
Tracking EPS and Sales Acceleration: A Guide to Identifying High-Growth Stocks

When focusing on high-growth stocks, understanding the concept of acceleration is crucial.
Acceleration occurs when growth metrics, such as sales (or revenue) and earnings per share (EPS), improve over successive periods. For instance, if a company's sales grew by 50% in the last quarter, up from 40% in the previous quarter, we can conclude that sales growth is accelerating.
This pattern indicates that the company is not only growing, but growing at an increasing rate, which multiple studies (here and here) have shown to be a strong indicator of potential investment success.
What is Q2Q Growth?
When we speak of "revenue grew 50% in the last quarter," we are referring to quarter-to-quarter (Q2Q) growth.
This metric compares the sales figures from the latest quarterly report (e.g., Q2 2024) to the same quarter from the previous year (e.g., Q2 2023). Q2Q growth provides a clear picture of how a company is performing on a year-over-year basis within the same time frame, eliminating seasonal variations.
Tracking EPS and Sales Growth with ChartMill
ChartMill offers comprehensive tools to track EPS and sales growth over multiple quarters. The platform provides Q2Q growth data for the last five quarters and the next two upcoming quarters, based on available estimates:
- EPS Growth Q2Q
- EPS Growth Q2Q (Q-1)
- EPS Growth Q2Q (Q-2)
- EPS Growth Q2Q (Q-3)
- EPS Growth Q2Q (Q-4)
- EPS Growth Q2Q (Q+1)
- EPS Growth Q2Q (Q+2)
For example, if the last reported quarter is Q2 2024, "EPS Growth Q2Q" compares Q2 2024 to Q2 2023, "EPS Growth Q2Q (Q-1)" compares Q1 2024 to Q1 2023, and so on.
These metrics are invaluable for creating custom views and expressions. To determine if there was an earnings growth acceleration in the last quarter, you would check if "EPS Growth Q2Q" is greater than "EPS Growth Q2Q (Q-1)."
To ensure positive growth in the previous quarter, you might add the expression "EPS Growth Q2Q (Q-1) > 0." Thus, one quarter of acceleration requires data from the last six quarters.
Built-in Filters for Acceleration
ChartMill simplifies this process with built-in filters for both quarterly and yearly EPS and sales growth acceleration. These filters allow investors to quickly identify stocks demonstrating positive acceleration trends.
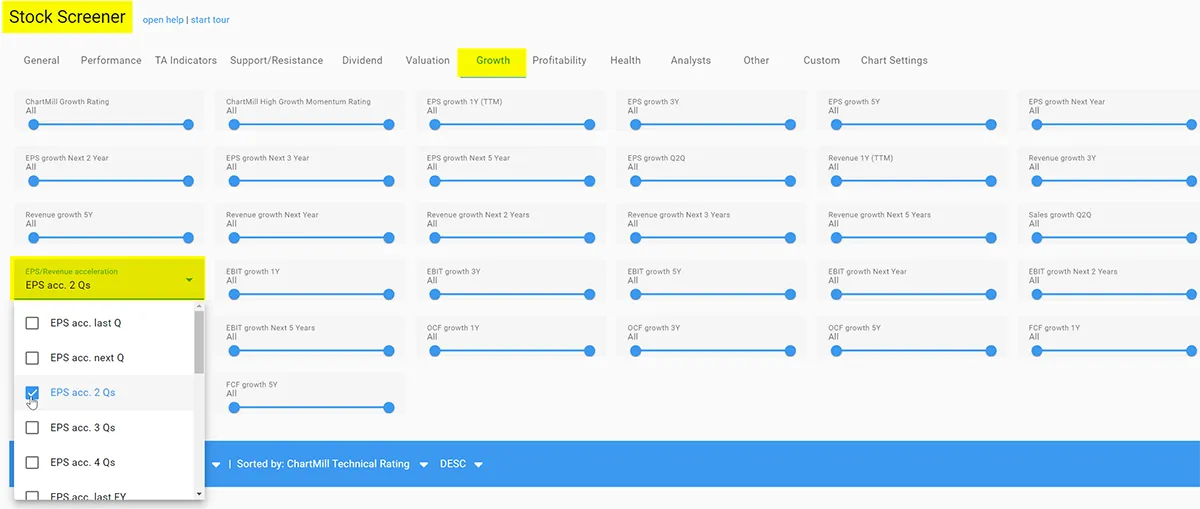
For more customized analysis, investors can also use custom expressions with the Q2Q numbers of the last five quarters and the year-over-year (Y2Y) numbers of the last four years.
Yearly Acceleration Metrics
The concept of acceleration can also be applied to yearly growth metrics. Yearly acceleration uses full-year reports to measure growth:
- EPS Growth 1Y (FY)
- EPS Growth 1Y (FY-1)
- EPS Growth 1Y (FY-2)
For instance, if the last full reported year was 2023, "EPS Growth 1Y (FY)" compares the EPS of 2023 to 2022, and "EPS Growth 1Y (FY-1)" compares 2022 to 2021. These annual statistics help investors understand long-term growth trends.
Together with quarterly figures, they provide a more complete picture of the growth rate of the company in question.
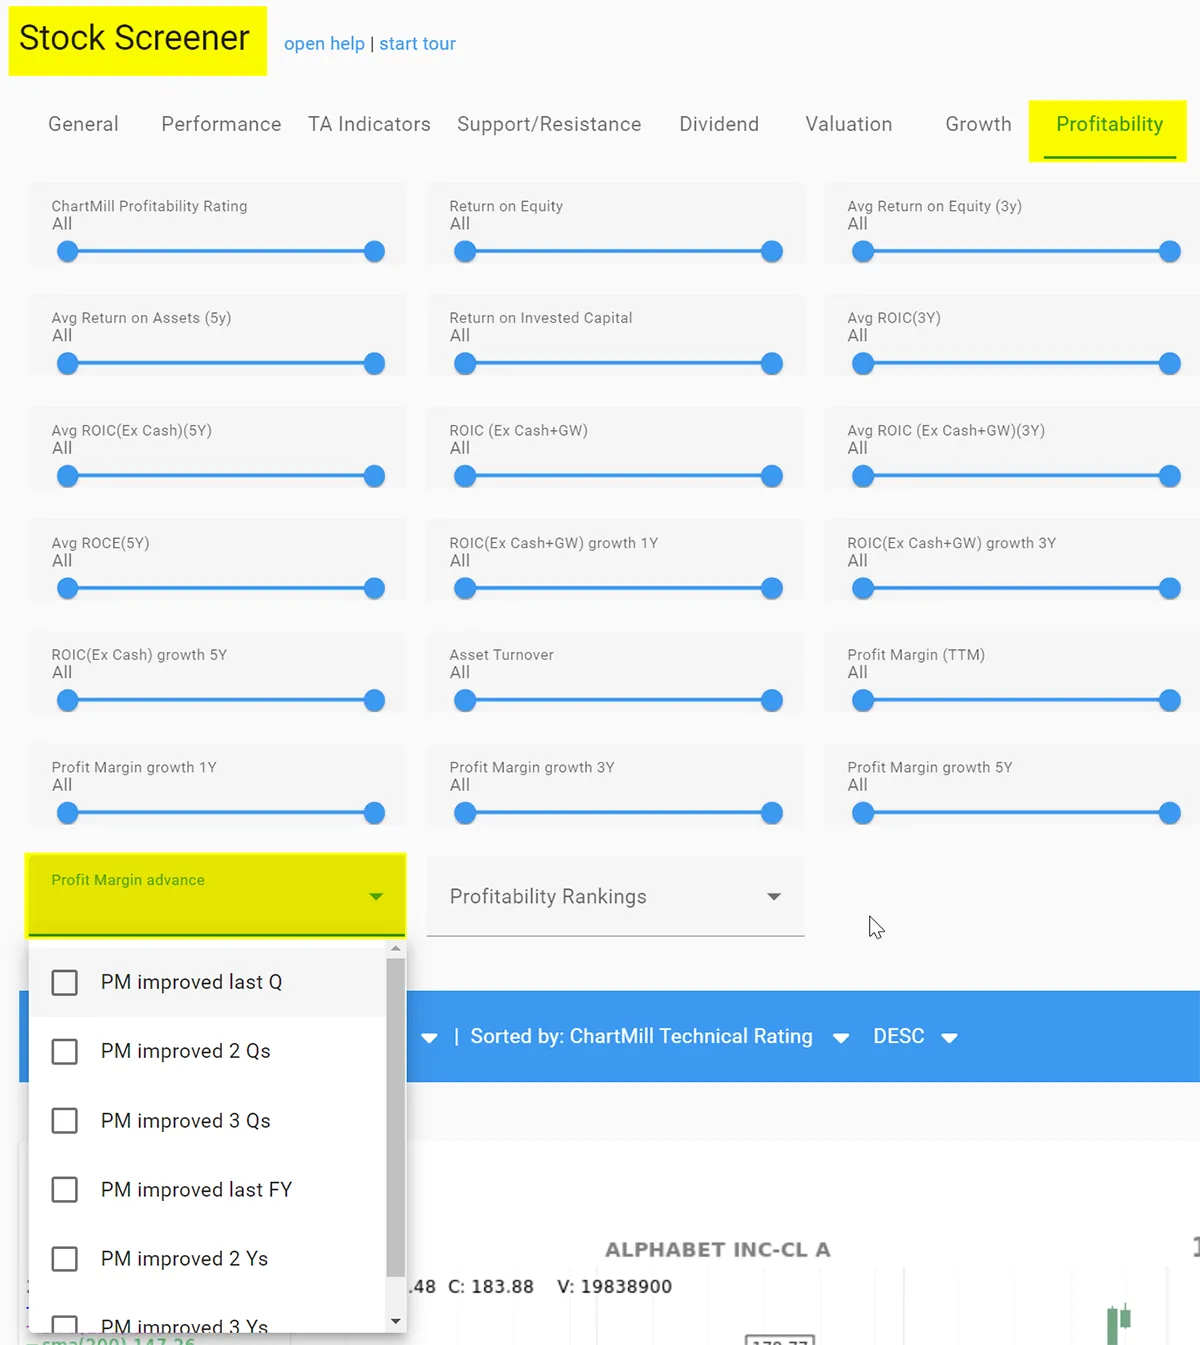
Profit Margin Improvement
Another important concept related to earnings and sales acceleration is the improvement of profit margins. Profit margin represents the percentage of sales that becomes net income.
ChartMill provides tools to check improving profit margins on both a quarterly and yearly basis:
- Profit Margin (Q)
- Profit Margin (Q-1)
- Profit Margin (Q-2)
- Profit Margin (Q-3)
- Profit Margin (FY)
- Profit Margin (FY-1)
- Profit Margin (FY-2)
- Profit Margin (FY-3)
 When EPS grows faster than sales, it indicates an increasing profit margin, meaning the company is earning more without proportionally increasing its costs.
Built-in filters on the profitability tab make it easy to track and analyze these improvements.
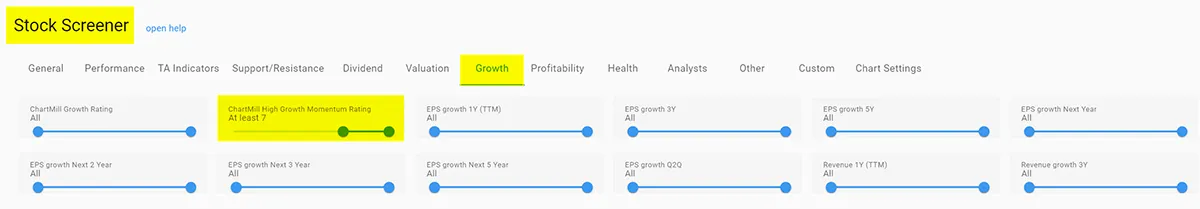
The ChartMill High Growth Momentum Rating
For those seeking a more streamlined approach, the ChartMill High Growth Momentum Rating combines several key metrics, including quarterly and yearly acceleration, to identify stocks with robust growth potential and momentum.
This rating system simplifies the process of finding high-growth stocks by integrating various indicators into a single, comprehensive score. Leveraging this rating can save time and enhance your ability to spot promising investment opportunities quickly.
Visualizing Growth Acceleration with the 'Earnings Table' extension.
ChartMill subscribers have access to an enhanced earnings table that can be added above or below the price chart. It shows EPS and sales growth on a quarterly basis. This feature allows investors to quickly see trends in growth metrics.

Conclusion
Understanding and using growth accelerating metrics, such as quarterly and annual earnings per share (EPS) and revenue growth, along with profit margin improvements, provide insight into the rate at which the company is growing.
This insight is important because multiple studies have shown that accelerated growth is a harbinger of outperformance. ChartMill's tools and built-in filters simplify this process, allowing you to identify high-growth stocks with confidence.