
Consider SITE CENTERS CORP (NYSE:SITC) as a top pick for dividend investors, identified by our stock screening tool. NYSE:SITC shines in terms of profitability, solvency, and liquidity, all while paying a decent dividend. Let's dive deeper into the analysis.
Assessing Dividend Metrics for NYSE:SITC
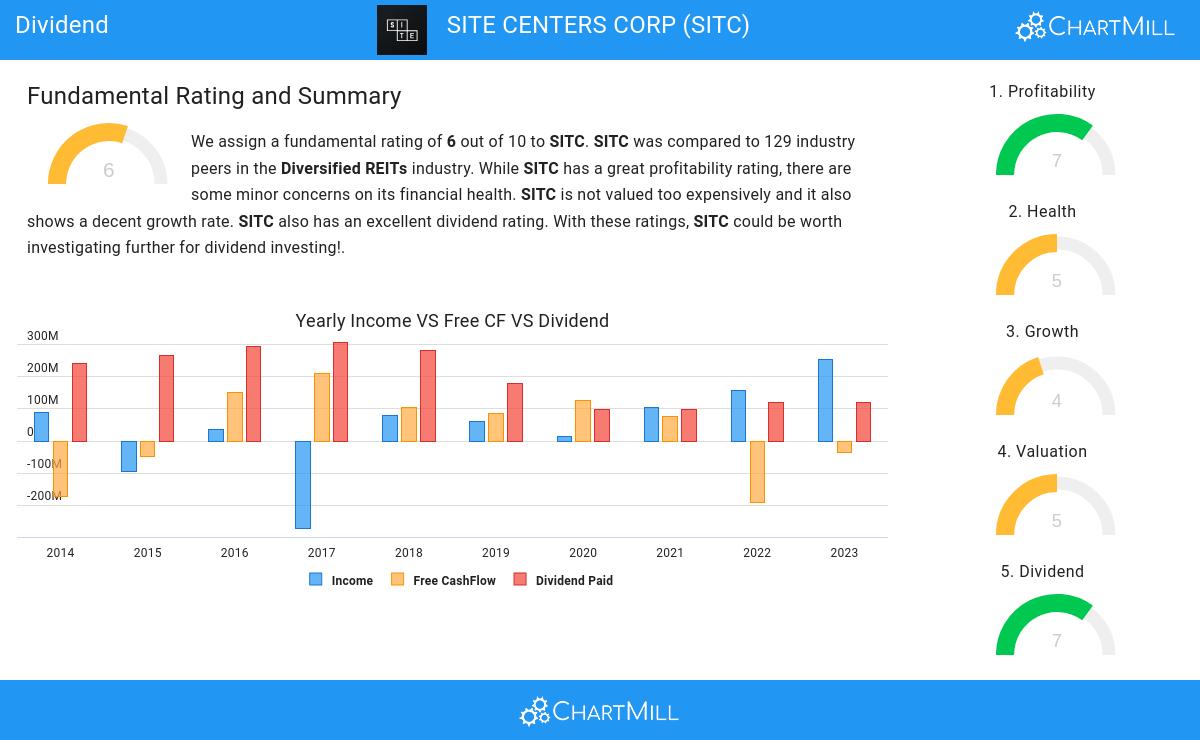
An integral part of ChartMill's stock analysis is the Dividend Rating, which spans from 0 to 10. This rating evaluates diverse dividend factors, including yield, historical data, growth, and sustainability. NYSE:SITC has received a 7 out of 10:
- With a Yearly Dividend Yield of 12.27%, SITC is a good candidate for dividend investing.
- SITC's Dividend Yield is rather good when compared to the industry average which is at 5.79. SITC pays more dividend than 95.28% of the companies in the same industry.
- Compared to an average S&P500 Dividend Yield of 2.22, SITC pays a better dividend.
- On average, the dividend of SITC grows each year by 8.32%, which is quite nice.
- SITC has been paying a dividend for at least 10 years, so it has a reliable track record.
- SITC pays out 34.38% of its income as dividend. This is a sustainable payout ratio.
How We Gauge Health for NYSE:SITC
ChartMill utilizes a Health Rating to assess stocks, scoring them on a scale of 0 to 10. This rating takes into account a variety of liquidity and solvency ratios, both in absolute terms and in comparison to industry peers. NYSE:SITC has earned a 5 out of 10:
- SITC has a better Debt to Equity ratio (0.65) than 77.95% of its industry peers.
- SITC has a Current Ratio of 6.25. This indicates that SITC is financially healthy and has no problem in meeting its short term obligations.
- With an excellent Current ratio value of 6.25, SITC belongs to the best of the industry, outperforming 95.28% of the companies in the same industry.
- SITC has a Quick Ratio of 6.25. This indicates that SITC is financially healthy and has no problem in meeting its short term obligations.
- The Quick ratio of SITC (6.25) is better than 95.28% of its industry peers.
Analyzing Profitability Metrics
ChartMill utilizes a Profitability Rating to assess stocks, scoring them on a scale of 0 to 10. This rating takes into account a variety of profitability ratios and margins, both in absolute terms and in comparison to industry peers. NYSE:SITC has earned a 7 out of 10:
- SITC has a Return On Assets of 11.07%. This is amongst the best in the industry. SITC outperforms 100.00% of its industry peers.
- Looking at the Return On Equity, with a value of 19.19%, SITC belongs to the top of the industry, outperforming 96.06% of the companies in the same industry.
- With an excellent Profit Margin value of 88.32%, SITC belongs to the best of the industry, outperforming 99.21% of the companies in the same industry.
- SITC's Profit Margin has improved in the last couple of years.
- SITC's Gross Margin of 69.95% is fine compared to the rest of the industry. SITC outperforms 60.63% of its industry peers.
More Best Dividend stocks can be found in our Best Dividend screener.
Check the latest full fundamental report of SITC for a complete fundamental analysis.
Keep in mind
This article should in no way be interpreted as advice. The article is based on the observed metrics at the time of writing, but you should always make your own analysis and trade or invest at your own responsibility.