
Here's NEUROCRINE BIOSCIENCES INC (NASDAQ:NBIX) for you, a growth stock our stock screener believes is undervalued. NASDAQ:NBIX is scoring impressively in terms of growth while demonstrating strong financials. On top of that, it remains attractively priced. Let's break it down further.
How We Gauge Growth for NASDAQ:NBIX
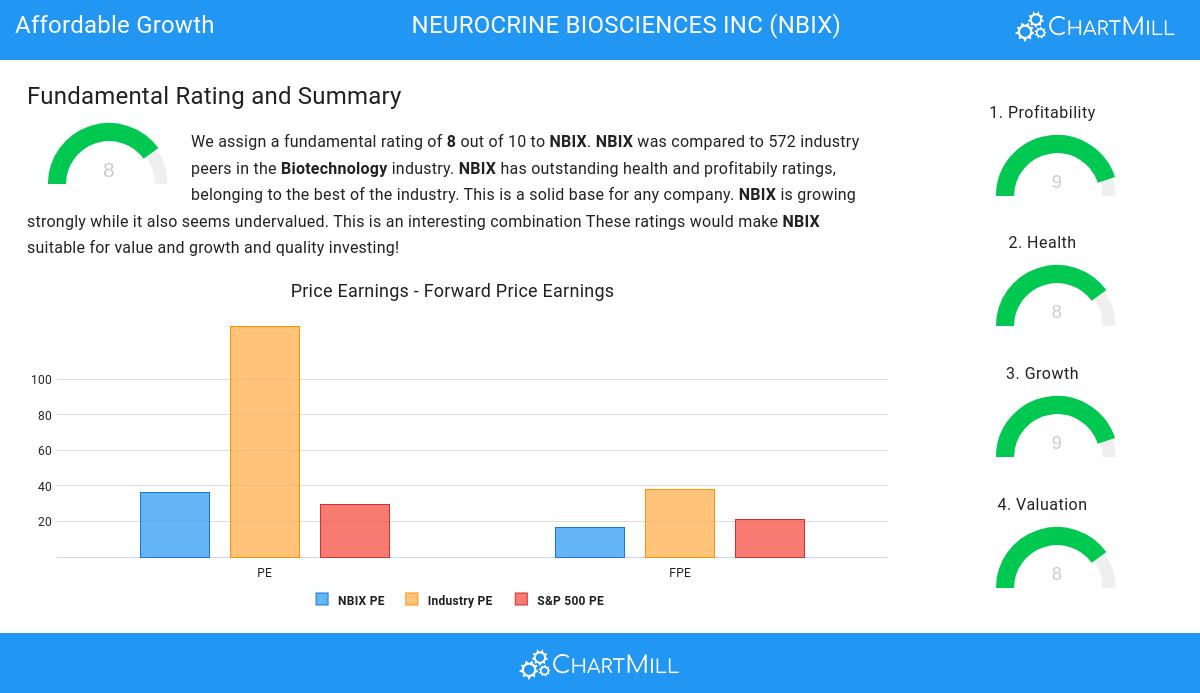
A key component of ChartMill's stock assessment is the Growth Rating, which spans from 0 to 10. This rating evaluates diverse growth factors, such as EPS and revenue growth, considering both past performance and future projections. NASDAQ:NBIX has received a 9 out of 10:
- The Earnings Per Share has grown by an impressive 91.33% over the past year.
- NBIX shows a strong growth in Earnings Per Share. Measured over the last years, the EPS has been growing by 70.09% yearly.
- Looking at the last year, NBIX shows a very strong growth in Revenue. The Revenue has grown by 26.69%.
- Measured over the past years, NBIX shows a very strong growth in Revenue. The Revenue has been growing by 33.13% on average per year.
- NBIX is expected to show a strong growth in Earnings Per Share. In the coming years, the EPS will grow by 44.72% yearly.
- Based on estimates for the next years, NBIX will show a quite strong growth in Revenue. The Revenue will grow by 15.24% on average per year.
Understanding NASDAQ:NBIX's Valuation Score
ChartMill employs its own Valuation Rating system for all stocks. This score, ranging from 0 to 10, is determined by evaluating different valuation factors, including price to earnings and free cash flow, both in absolute terms and relative to the market and industry. NASDAQ:NBIX has earned a 8 for valuation:
- 95.41% of the companies in the same industry are more expensive than NBIX, based on the Price/Earnings ratio.
- 95.76% of the companies in the same industry are more expensive than NBIX, based on the Price/Forward Earnings ratio.
- NBIX is valuated rather cheaply when we compare the Price/Forward Earnings ratio to 21.38, which is the current average of the S&P500 Index.
- Compared to the rest of the industry, the Enterprise Value to EBITDA ratio of NBIX indicates a rather cheap valuation: NBIX is cheaper than 95.76% of the companies listed in the same industry.
- 96.82% of the companies in the same industry are more expensive than NBIX, based on the Price/Free Cash Flow ratio.
- NBIX's low PEG Ratio(NY), which compensates the Price/Earnings for growth, indicates a rather cheap valuation of the company.
- The excellent profitability rating of NBIX may justify a higher PE ratio.
- NBIX's earnings are expected to grow with 57.66% in the coming years. This may justify a more expensive valuation.
Analyzing Health Metrics
ChartMill employs its own Health Rating for stock assessment. This rating, ranging from 0 to 10, is calculated by examining various liquidity and solvency ratios. In the case of NASDAQ:NBIX, the assigned 8 reflects its health status:
- NBIX has an Altman-Z score of 10.78. This indicates that NBIX is financially healthy and has little risk of bankruptcy at the moment.
- NBIX has a better Altman-Z score (10.78) than 87.28% of its industry peers.
- There is no outstanding debt for NBIX. This means it has a Debt/Equity and Debt/FCF ratio of 0 and it is amongst the best of the sector and industry.
- A Current Ratio of 4.19 indicates that NBIX has no problem at all paying its short term obligations.
- NBIX has a Quick Ratio of 4.08. This indicates that NBIX is financially healthy and has no problem in meeting its short term obligations.
Understanding NASDAQ:NBIX's Profitability
ChartMill assigns a proprietary Profitability Rating to each stock. The score is computed by evaluating various profitability ratios and margins and ranges from 0 to 10. NASDAQ:NBIX was assigned a score of 9 for profitability:
- NBIX has a better Return On Assets (10.26%) than 97.00% of its industry peers.
- NBIX's Return On Equity of 13.52% is amongst the best of the industry. NBIX outperforms 96.64% of its industry peers.
- NBIX's Return On Invested Capital of 13.81% is amongst the best of the industry. NBIX outperforms 96.82% of its industry peers.
- The 3 year average ROIC (9.89%) for NBIX is below the current ROIC(13.81%), indicating increased profibility in the last year.
- Looking at the Profit Margin, with a value of 16.00%, NBIX belongs to the top of the industry, outperforming 97.17% of the companies in the same industry.
- In the last couple of years the Profit Margin of NBIX has grown nicely.
- NBIX's Operating Margin of 25.70% is amongst the best of the industry. NBIX outperforms 97.88% of its industry peers.
- NBIX's Operating Margin has improved in the last couple of years.
- Looking at the Gross Margin, with a value of 98.28%, NBIX belongs to the top of the industry, outperforming 97.88% of the companies in the same industry.
Our Affordable Growth screener lists more Affordable Growth stocks and is updated daily.
For an up to date full fundamental analysis you can check the fundamental report of NBIX
Keep in mind
This article should in no way be interpreted as advice. The article is based on the observed metrics at the time of writing, but you should always make your own analysis and trade or invest at your own responsibility.