
Our stock screener has singled out GLOBE LIFE INC (NYSE:GL) as a stellar value proposition. NYSE:GL not only scores well in profitability, solvency, and liquidity but also maintains a very reasonable price point. We'll explore this further.
Exploring NYSE:GL's Valuation
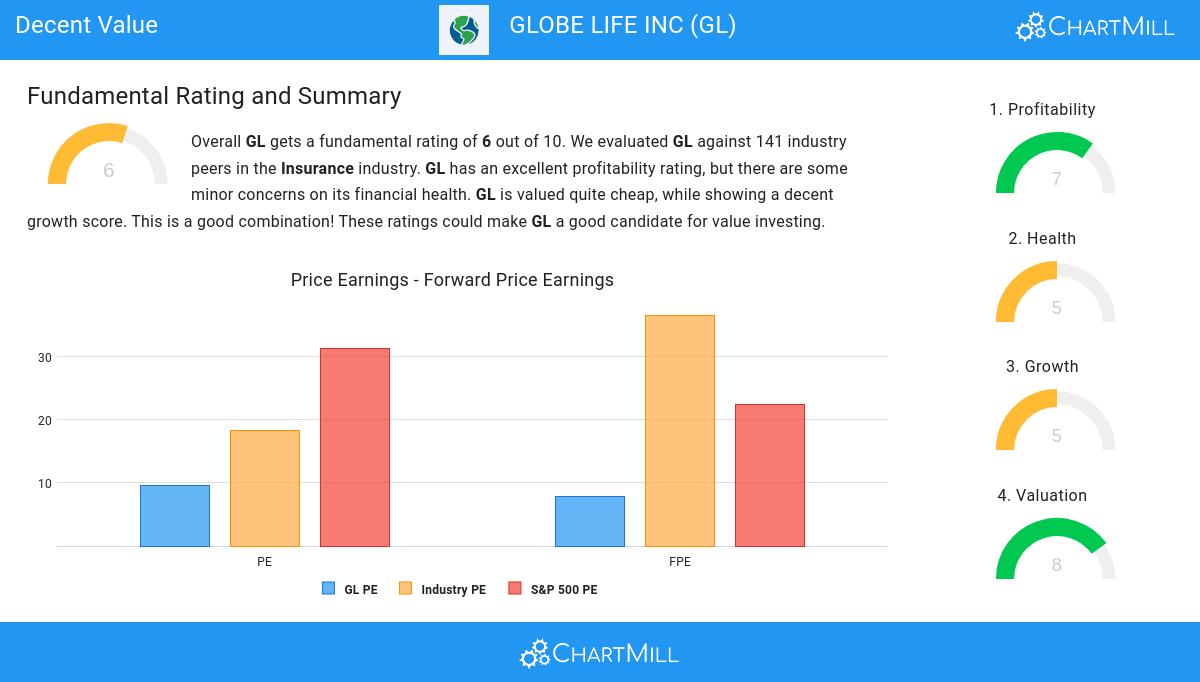
To assess a stock's valuation, ChartMill utilizes a Valuation Rating on a scale of 0 to 10. This comprehensive assessment considers various valuation aspects, comparing price to earnings and cash flows, while factoring in profitability and growth. NYSE:GL has achieved a 8 out of 10:
- GL is valuated reasonably with a Price/Earnings ratio of 9.52.
- Based on the Price/Earnings ratio, GL is valued a bit cheaper than the industry average as 64.75% of the companies are valued more expensively.
- GL is valuated cheaply when we compare the Price/Earnings ratio to 31.24, which is the current average of the S&P500 Index.
- With a Price/Forward Earnings ratio of 7.87, the valuation of GL can be described as very cheap.
- GL's Price/Forward Earnings ratio is a bit cheaper when compared to the industry. GL is cheaper than 69.78% of the companies in the same industry.
- When comparing the Price/Forward Earnings ratio of GL to the average of the S&P500 Index (22.44), we can say GL is valued rather cheaply.
- 75.54% of the companies in the same industry are more expensive than GL, based on the Enterprise Value to EBITDA ratio.
- Compared to the rest of the industry, the Price/Free Cash Flow ratio of GL indicates a somewhat cheap valuation: GL is cheaper than 60.43% of the companies listed in the same industry.
- The low PEG Ratio(NY), which compensates the Price/Earnings for growth, indicates a rather cheap valuation of the company.
- GL has a very decent profitability rating, which may justify a higher PE ratio.
- GL's earnings are expected to grow with 12.27% in the coming years. This may justify a more expensive valuation.
Assessing Profitability for NYSE:GL
ChartMill assigns a Profitability Rating to every stock. This score ranges from 0 to 10 and evaluates the different profitability ratios and margins, both absolutely, but also relative to the industry peers. NYSE:GL scores a 7 out of 10:
- GL has a better Return On Assets (3.69%) than 74.82% of its industry peers.
- The Return On Equity of GL (19.98%) is better than 80.58% of its industry peers.
- The Return On Invested Capital of GL (4.17%) is better than 76.26% of its industry peers.
- The last Return On Invested Capital (4.17%) for GL is above the 3 year average (3.89%), which is a sign of increasing profitability.
- GL has a better Profit Margin (18.47%) than 84.17% of its industry peers.
- GL's Profit Margin has improved in the last couple of years.
- Looking at the Operating Margin, with a value of 24.89%, GL belongs to the top of the industry, outperforming 84.89% of the companies in the same industry.
Assessing Health for NYSE:GL
ChartMill assigns a Health Rating to every stock. This score ranges from 0 to 10 and evaluates the different health aspects like liquidity and solvency, both absolutely, but also relative to the industry peers. NYSE:GL scores a 5 out of 10:
- GL has a better Altman-Z score (0.98) than 82.01% of its industry peers.
- The Debt to FCF ratio of GL is 1.69, which is an excellent value as it means it would take GL, only 1.69 years of fcf income to pay off all of its debts.
- A Debt/Equity ratio of 0.40 indicates that GL is not too dependend on debt financing.
- With a decent Current ratio value of 0.48, GL is doing good in the industry, outperforming 73.38% of the companies in the same industry.
- GL has a Quick ratio of 0.48. This is in the better half of the industry: GL outperforms 73.38% of its industry peers.
Deciphering NYSE:GL's Growth Rating
ChartMill assigns a proprietary Growth Rating to each stock. The score is computed by evaluating various growth aspects, like EPS and revenue growth. We take into account the history as well as the estimated future numbers. NYSE:GL was assigned a score of 5 for growth:
- The Earnings Per Share has grown by an nice 18.15% over the past year.
- Measured over the past years, GL shows a quite strong growth in Earnings Per Share. The EPS has been growing by 11.68% on average per year.
- GL is expected to show quite a strong growth in Earnings Per Share. In the coming years, the EPS will grow by 10.29% yearly.
- The Revenue growth rate is accelerating: in the next years the growth will be better than in the last years.
More Decent Value stocks can be found in our Decent Value screener.
Our latest full fundamental report of GL contains the most current fundamental analsysis.
Disclaimer
Important Note: The content of this article is not intended as trading advice. It is essential to perform your own analysis and exercise caution when making trading decisions. The article presents observations created by automated analysis but does not guarantee any trading or investment outcomes. Always trade responsibly and make independent judgments.