
Our stock screener has singled out FIVE BELOW (NASDAQ:FIVE) as an attractive growth opportunity. NASDAQ:FIVE is demonstrating remarkable growth potential while maintaining strong financial indicators, making it a reasonably priced option. We'll explore this further.
Growth Insights: NASDAQ:FIVE
To evaluate a stock's growth potential, ChartMill utilizes a Growth Rating on a scale of 0 to 10. This comprehensive assessment considers various growth aspects, including historical and estimated EPS and revenue growth. NASDAQ:FIVE has achieved a 7 out of 10:
- Measured over the past years, FIVE shows a quite strong growth in Earnings Per Share. The EPS has been growing by 15.56% on average per year.
- The Revenue has grown by 14.24% in the past year. This is quite good.
- The Revenue has been growing by 17.94% on average over the past years. This is quite good.
- FIVE is expected to show a strong growth in Earnings Per Share. In the coming years, the EPS will grow by 25.19% yearly.
- Based on estimates for the next years, FIVE will show a quite strong growth in Revenue. The Revenue will grow by 16.34% on average per year.
- When comparing the EPS growth rate of the last years to the growth rate of the upcoming years, we see that the growth is accelerating.
A Closer Look at Valuation for NASDAQ:FIVE
An integral part of ChartMill's stock analysis is the Valuation Rating, which spans from 0 to 10. This rating evaluates diverse valuation factors, including price to earnings and cash flows, while considering the stock's profitability and growth. NASDAQ:FIVE has received a 5 out of 10:
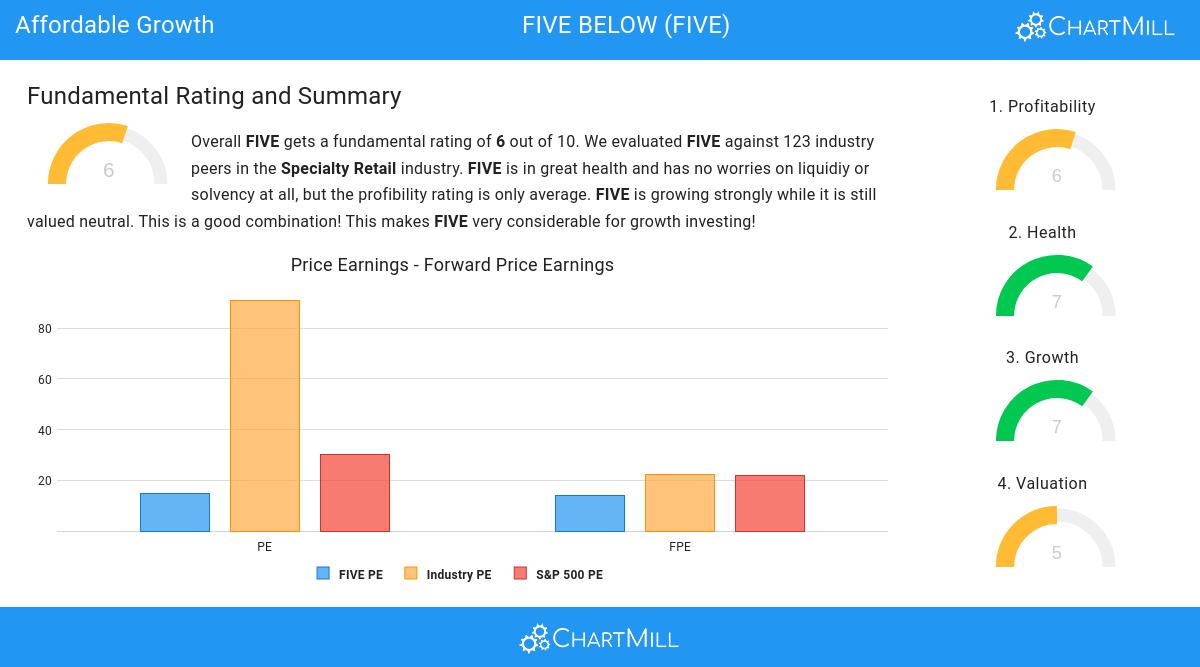
- FIVE's Price/Earnings ratio is a bit cheaper when compared to the industry. FIVE is cheaper than 71.31% of the companies in the same industry.
- Compared to an average S&P500 Price/Earnings ratio of 30.30, FIVE is valued rather cheaply.
- 68.85% of the companies in the same industry are more expensive than FIVE, based on the Price/Forward Earnings ratio.
- When comparing the Price/Forward Earnings ratio of FIVE to the average of the S&P500 Index (21.86), we can say FIVE is valued slightly cheaper.
- FIVE's Enterprise Value to EBITDA ratio is a bit cheaper when compared to the industry. FIVE is cheaper than 72.13% of the companies in the same industry.
- The decent profitability rating of FIVE may justify a higher PE ratio.
Evaluating Health: NASDAQ:FIVE
ChartMill utilizes a Health Rating to assess stocks, scoring them on a scale of 0 to 10. This rating takes into account a variety of liquidity and solvency ratios, both in absolute terms and in comparison to industry peers. NASDAQ:FIVE has earned a 7 out of 10:
- Looking at the Altman-Z score, with a value of 2.90, FIVE is in the better half of the industry, outperforming 68.03% of the companies in the same industry.
- There is no outstanding debt for FIVE. This means it has a Debt/Equity and Debt/FCF ratio of 0 and it is amongst the best of the sector and industry.
- The Current ratio of FIVE (1.63) is better than 65.57% of its industry peers.
- With a decent Quick ratio value of 0.70, FIVE is doing good in the industry, outperforming 60.66% of the companies in the same industry.
Profitability Assessment of NASDAQ:FIVE
ChartMill assigns a Profitability Rating to every stock. This score ranges from 0 to 10 and evaluates the different profitability ratios and margins, both absolutely, but also relative to the industry peers. NASDAQ:FIVE scores a 6 out of 10:
- Looking at the Return On Assets, with a value of 7.01%, FIVE is in the better half of the industry, outperforming 76.23% of the companies in the same industry.
- The Return On Equity of FIVE (17.49%) is better than 75.41% of its industry peers.
- The Return On Invested Capital of FIVE (8.18%) is better than 68.03% of its industry peers.
- With an excellent Profit Margin value of 7.57%, FIVE belongs to the best of the industry, outperforming 81.97% of the companies in the same industry.
- Looking at the Operating Margin, with a value of 9.75%, FIVE belongs to the top of the industry, outperforming 82.79% of the companies in the same industry.
Our Affordable Growth screener lists more Affordable Growth stocks and is updated daily.
For an up to date full fundamental analysis you can check the fundamental report of FIVE
Keep in mind
This is not investing advice! The article highlights some of the observations at the time of writing, but you should always make your own analysis and invest based on your own insights.