
US Market Update
By Mill Chart
Last update: May 4, 2022
Our last general market update dates from just a month ago. Meanwhile, we are October 17, 2021, the first results of the third quarter are known. It was mainly a number of financial companies that announced their results. And they all performed much better than expected, both in terms of sales and profits. Next week more than 300 US companies will announce their results, so time for another short update.
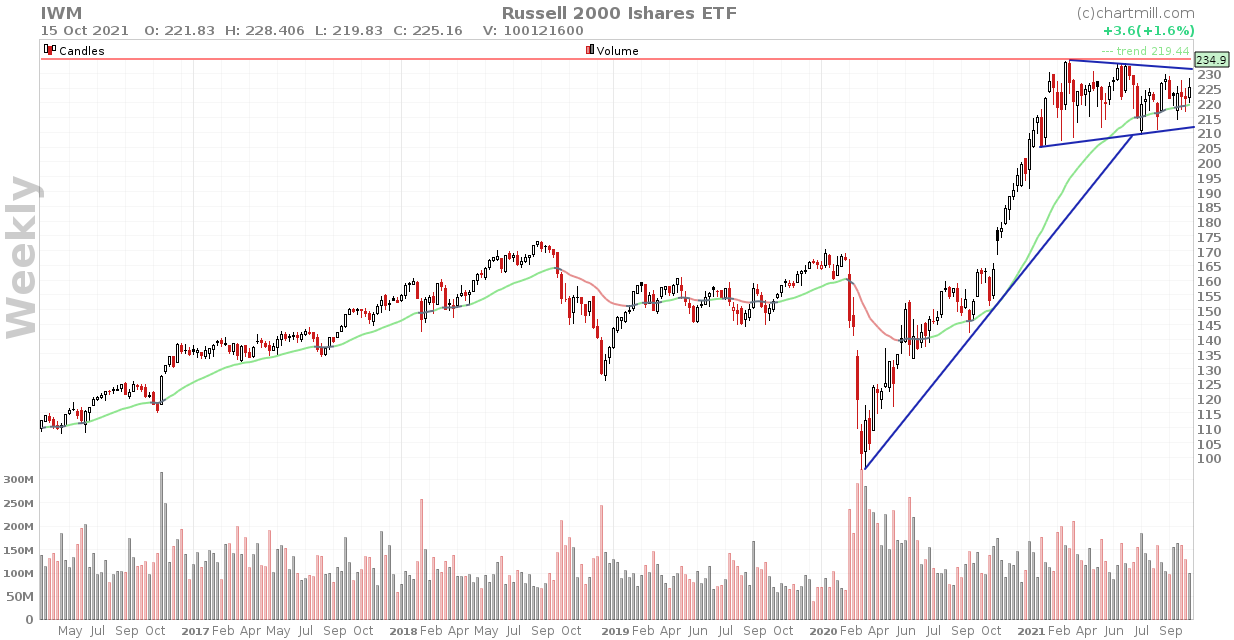
As always, we use the four US index ETFs on the weekly timeframe to capture the long-term technical picture of the markets. Our ChartMill Trend Indicator, based on a 30-week exponential moving average, acts as a guide here. We indicated last month that the long-term bullish trend was still intact and nothing has changed in that regard for this update.... And just like last month, the Russel 2000 remains the somewhat weaker performer. The price is caught in an increasingly narrow symmetrical triangle pattern.
For the DIA, QQQ and SPY, we are noticing that price bounced up from its EMA30. All three ETF’s are showing clear signs of a technical reversal pattern. Being a second to last candle with undertail, pivoted right on the ChartMiill Trend Indicator, followed by the last candle ending at the high of week.
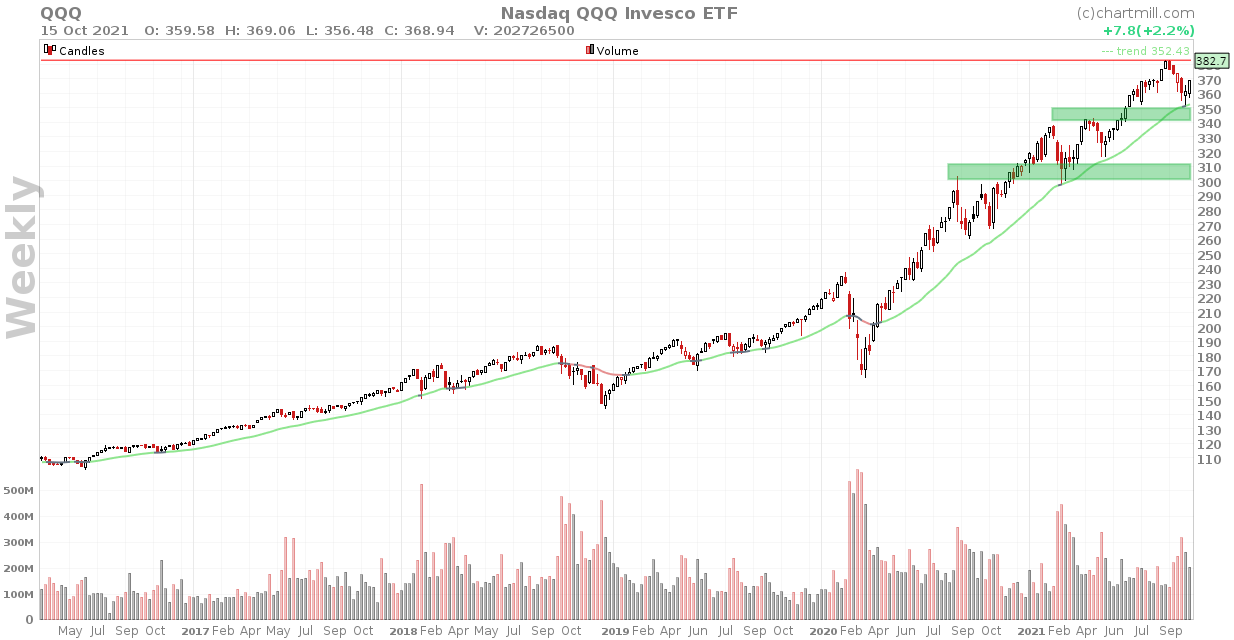
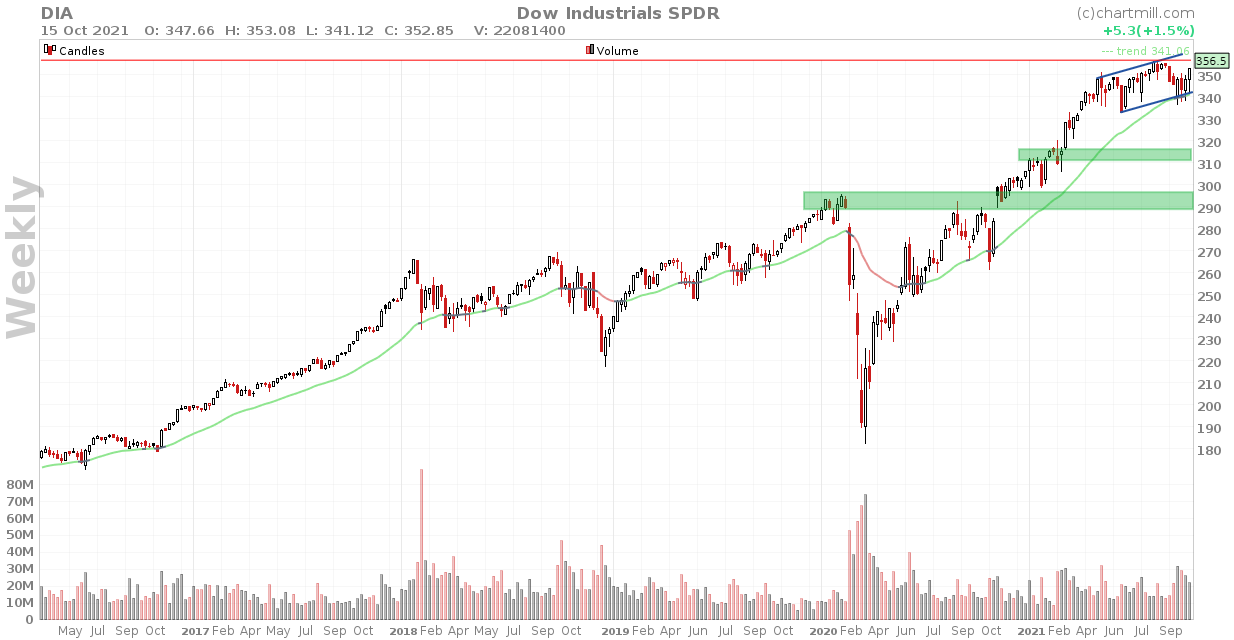
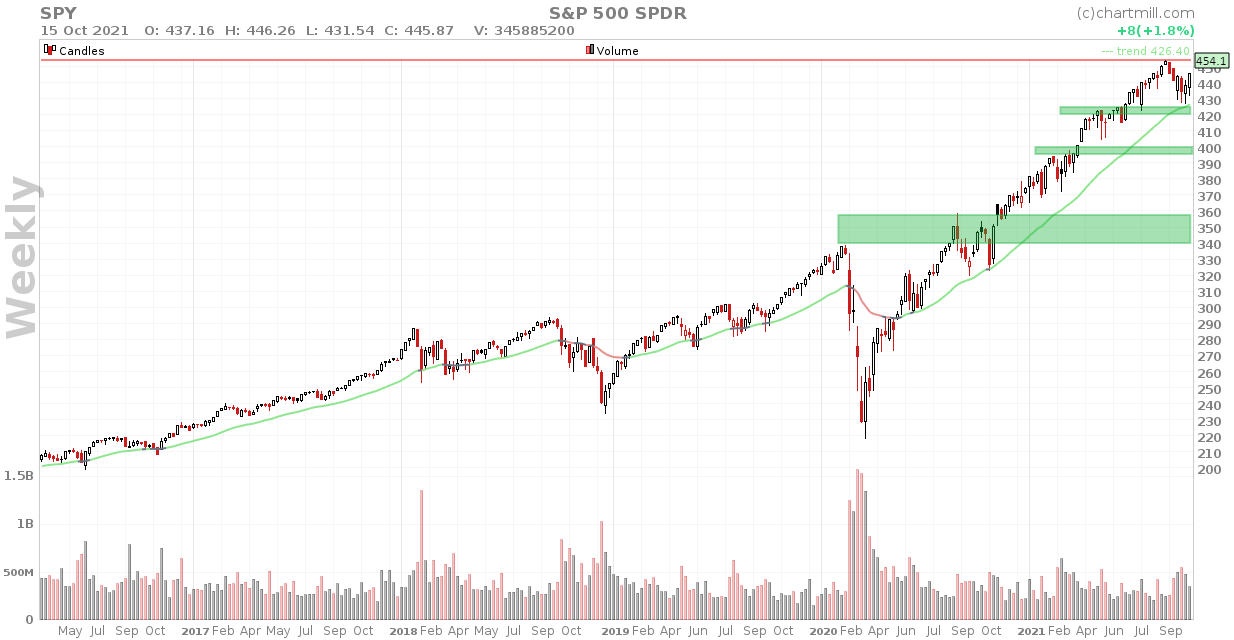
As far as we are concerned, there is a very good chance that from this price level the existing highs will be tested again. Especially since statistically the best months are yet to come, november and december. Since 1950 to 2020, the results for the month of November have been mostly positive (48 up years and 23 down years) with an average return of 1.53%. December even has 53 up years and only 18 down years but the average return is still slightly lower (1.39%). But a word of caution is definitely in order here. Of course, this says absolutely nothing about the performance of individual stocks. Nevertheless, it is information that is interesting to keep in mind and take into account.
We are especially curious about the results that will be announced in the coming week and how they will affect market sentiment. If we again take a look at the Fear & Greed Index, it has changed from 'fear' to 'neutral' since last month.
So green next month?
The links below provide you with an overview of companies that will be announcing results next week, divided by the stock exchange on which they are listed.
Quarterly results between 18 and 22 October 2021 Nasdaq
Quarterly results between 18 and 22 October 2021 S&P500
Quarterly results between 18 and 22 October 2021 Dow Jones
Quarterly results between 18 and 22 October 2021 Russel2000
Trade safe!
The ChartMill Team
![]()
![]()
![]()
![]()
ISHARES RUSSELL 2000 ETF
NYSEARCA:IWM (5/8/2024, 11:54:09 AM)
203.15
-1.82 (-0.89%)
IWM News
 9 hours ago - The Motley FoolThe U.S. Is About to Spend Hundreds of Billions on Clean Energy Subsidies: 1 Amazing ETF to Reap the Benefits
This ETF offers a smartly diversified index of companies throughout the green energy and energy-efficiency value chains.