
Are tech stocks bottoming out?
Last update: Jan 16, 2023
2022 was a grim year for many investors. Especially technology stocks, which are seen as typical growth stocks, saw a lot of their market value disappear. The reason is obvious. Skyrocketing inflation and the Fed systematically raising interest rates in an attempt to dampen that same inflation.
Rising interest rates are pretty negative for growth stocks. There are several reasons for this:
-
Companies in their full growth phase are in much greater need of financing. With previously traditionally low interest rates, borrowing was extremely cheap but those days are now behind us. Borrowing money has become a lot more expensive for companies.
-
Growth companies are placing particular emphasis on future profits. As long as interest rates remain low, there is no problem with the present value of those future profits. However, that changes with rising interest rates which, when converted, reduces the present value of those future profits.
-
And if there are profits at all, they are rarely distributed because they are better used to finance the company's continued growth.
Therefore, the CPI figure, latest friday, Jan. 13, 2023, was eagerly awaited. This came in at 6.5%, which was fully in line with expectations and represented a decrease of 0.1% with the previous month.
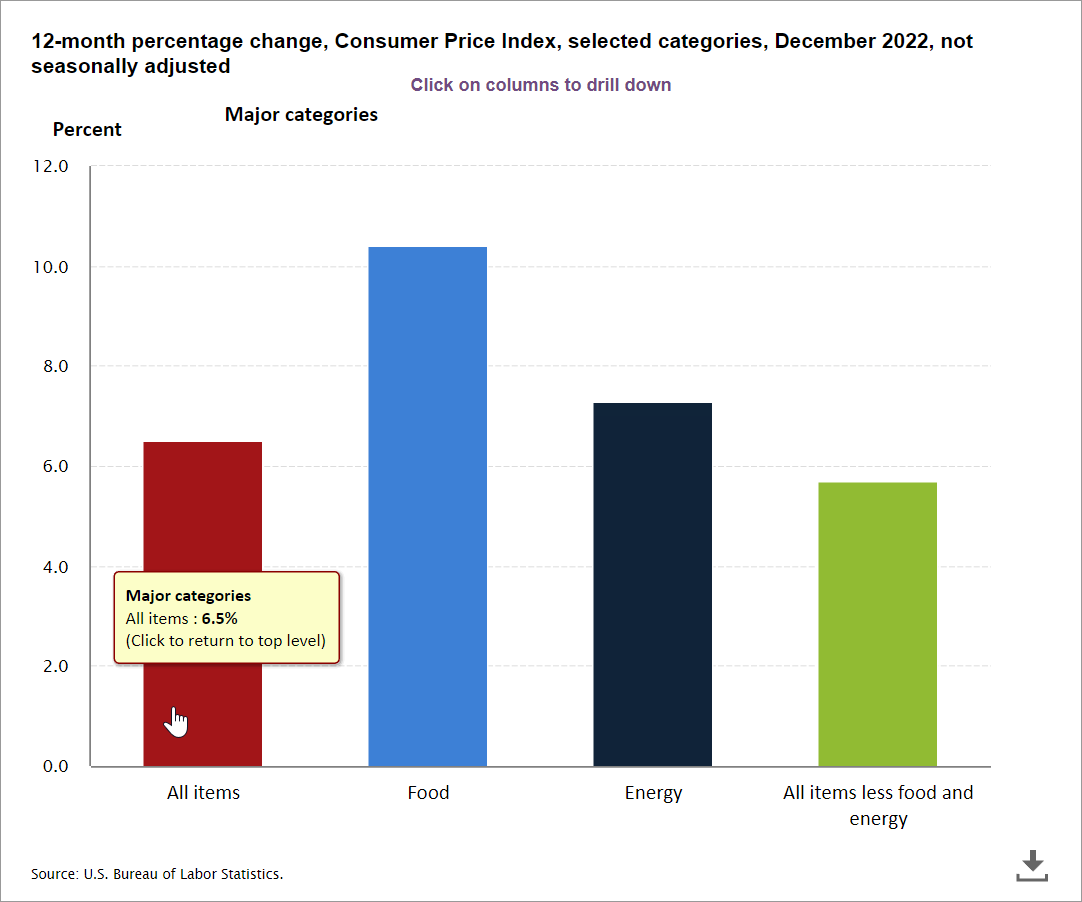
That the market reacted positively was not so much because of the figure itself but rather the comments made by Fed Official Patrick Harker. He stated that the 0.75% rate hikes are behind us and that there will be a return to 0.25% rate hikes. However, it was immediately added that interest rates must move toward 5% anyway.
Since mid-September 2022, the Dow Jones Industrial in particular has recovered significantly. The other US index etf's are also showing signs of bottoming out. The QQQ remains the weakest. Quite logical, since it includes all the major companies in the technology sector, not surprisingly the sector that has taken the hardest hit so far.
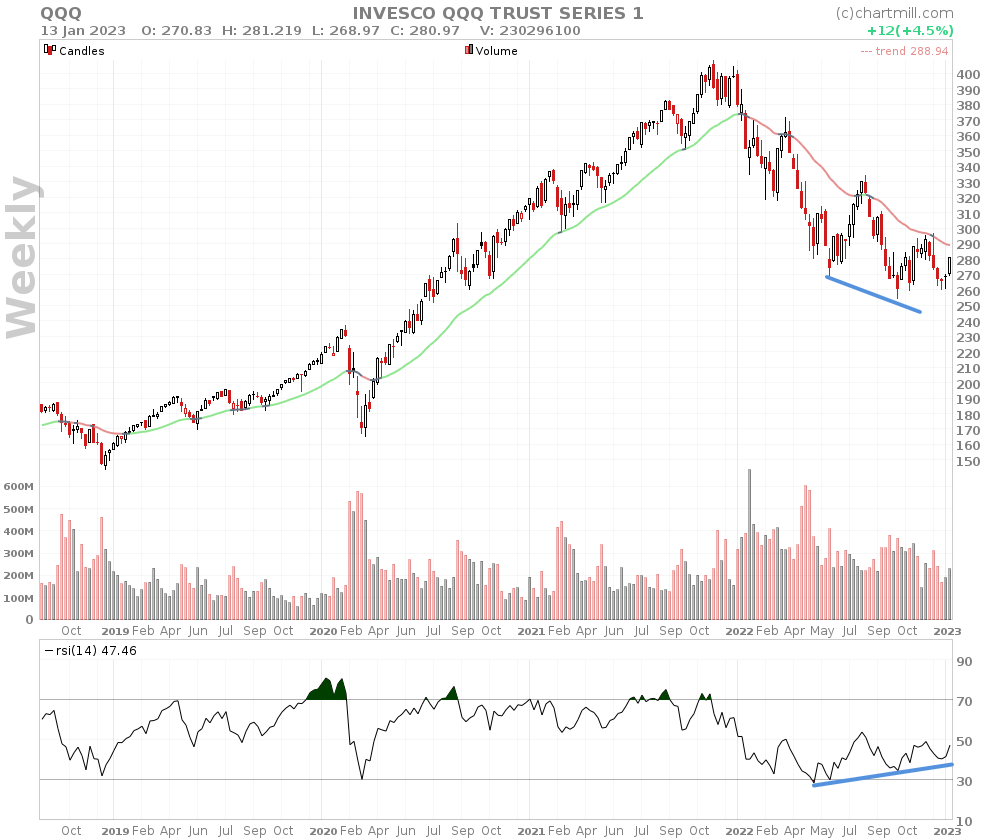
The long-term trend for the QQQ ( shown on the chart with the ChartMill Trend indicator) is still bearish. Nevertheless, there are some early signs of bottom formation. In particular, a positive divergence with the RSI indicator. That indicator shows higher bottoms while the price still showed a lower bottom during the same period.
To say that now is the time to pick up massively depreciated technology stocks is an exaggeration, but it can't hurt to already make a list of stocks that are starting to look interesting from a technical point of view. And with the ChartMill stock screener, that's just a click away!
Since we want to limit our search to the technology sector, we only include stocks listed on the NASDAQ stock exchange with a minimum volume of 500,000 and a minimum price of $20. To keep things clear, we split our search into two different screening filters based on the market cap of the companies in question.
Screening Filter 1
Market cap MEGA (+200B) - stocks that are still trading at least 20% below their highest price in the past 12 months.
Direct link to this filter with historical date set to friday january 13, 2023
Direct link to the filter (same filters without historical date set, the list is updated automatically after each trading day.)
This includes only 8 stocks at the time of writing, a strict selection of very big names that everyone undoubtedly knows.
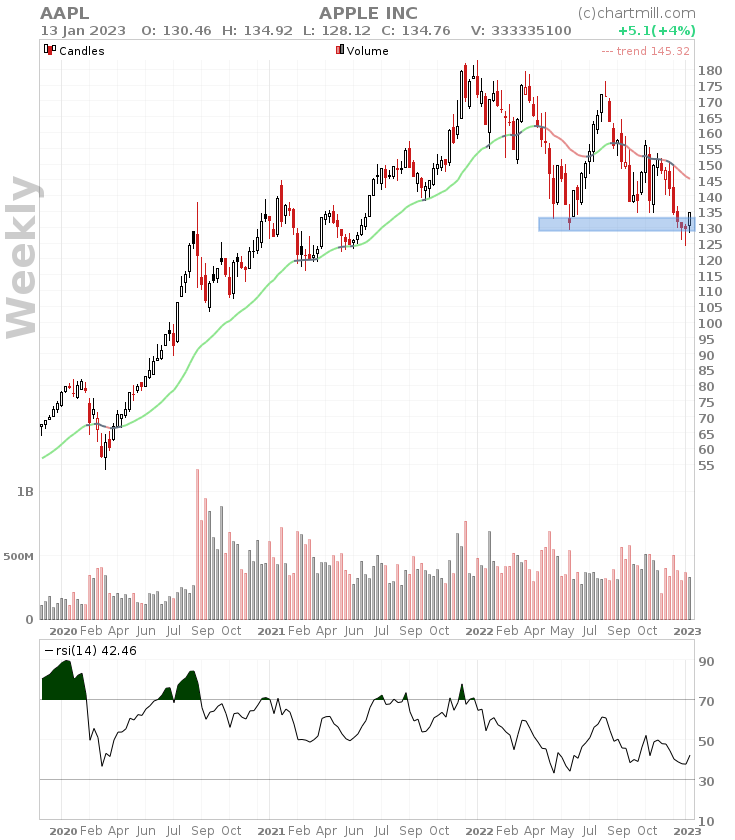
Apple (AAPL) has recovered 4% on a weekly basis, confirming a double price bottom on the weekly chart. The price is now quoted at the bottom of the sideways price range. However, buying volume remains relatively low.
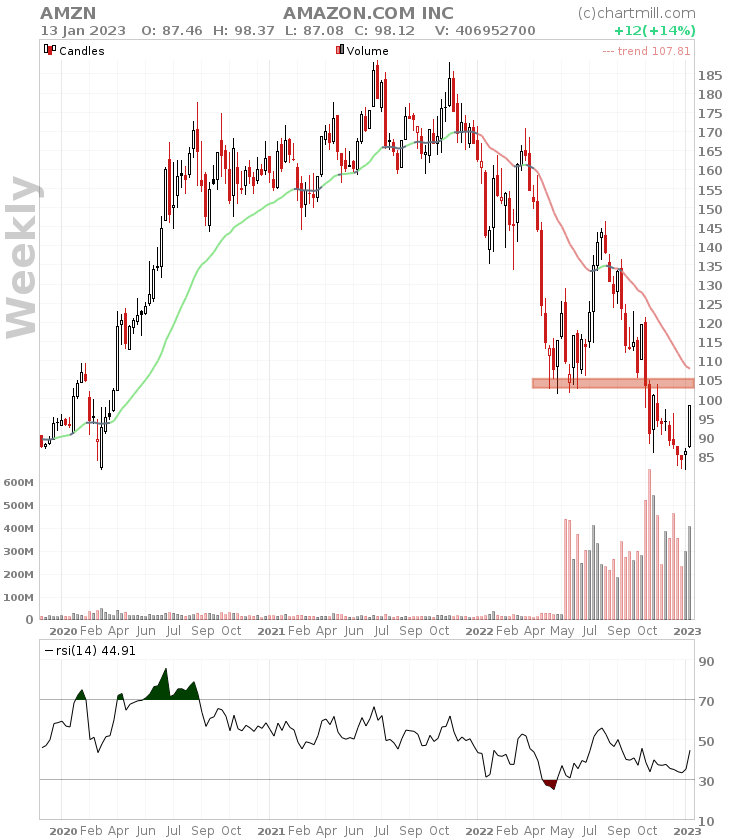
Amazon (AMZN) rose 14% over the past week and is the largest gainer within this select group. The associated volume was quite strong. However, the long-term trend remains heavily negative. In the short term, we expect a retest of resistance which is at $105.
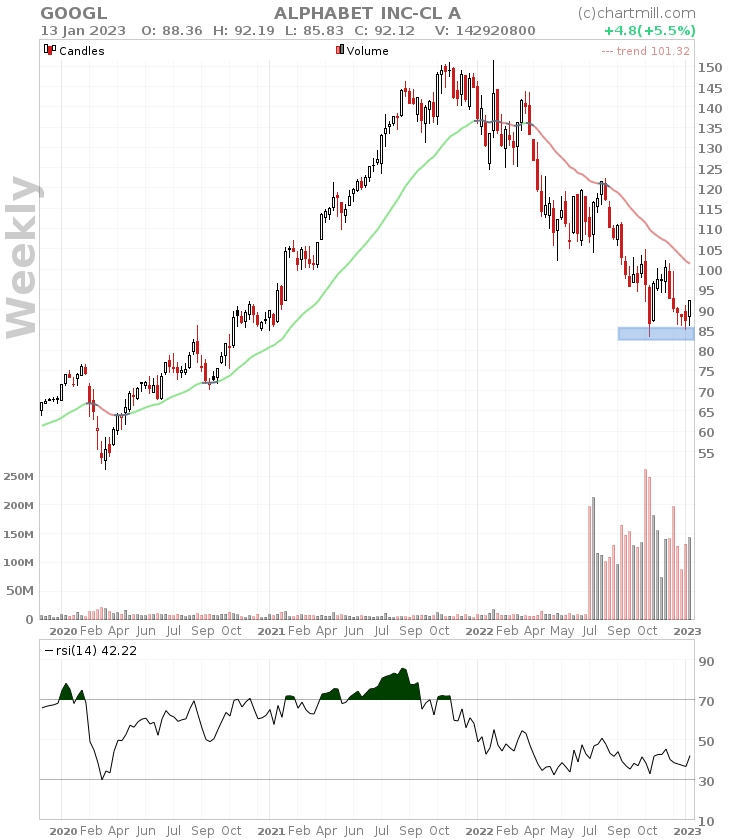
Alphabet (GOOG) advanced just over 5% and currently appears to be forming a double bottom.
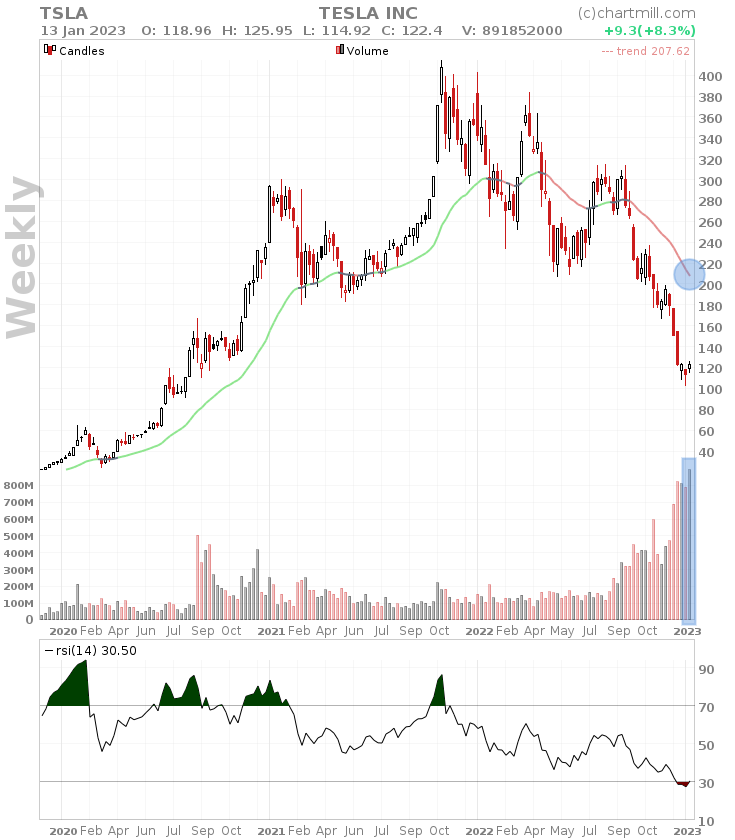
Lots of buyers for Tesla (TSLA) which has been struggling in recent weeks. The decline is extreme and the price is well below the falling ChartMill Trend indicator which certainly makes an interim recovery plausible. The RSI is quoting below 30 but you should note that such signals are much less reliable in a sharply falling trend.
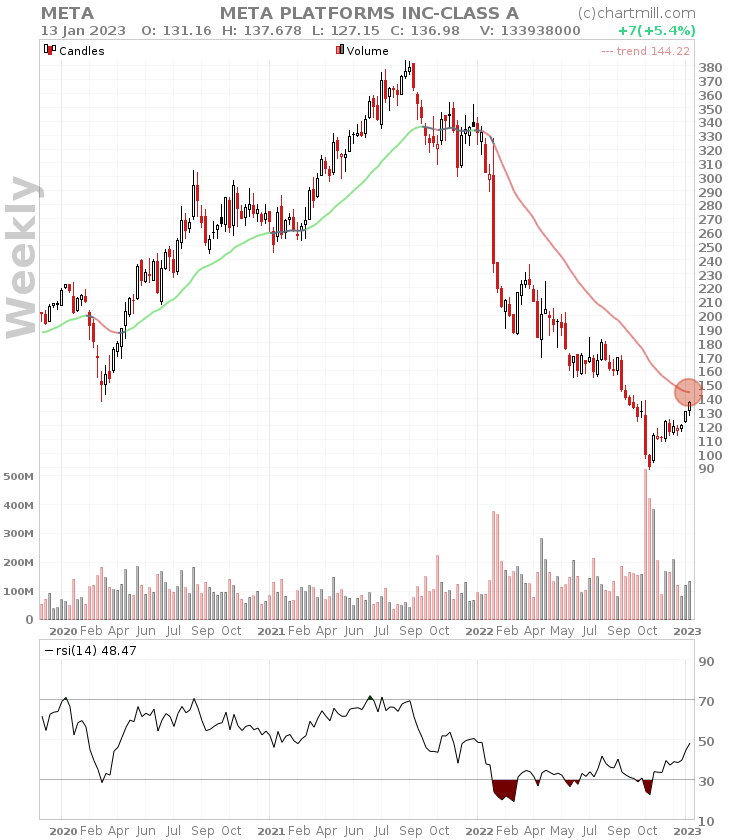
Meta Platforms (META) recovered sharply since October, the close on 31/10 was just above $90. Friday, January 13, the closing price was $137.67, an increase of more than 50%. However, to put this rise in perspective, we also mention the price at which the stock was quoted on 30/08/2022: $376... Currently, the price is close to the declining 30-week moving average line, which may provide some resistance.
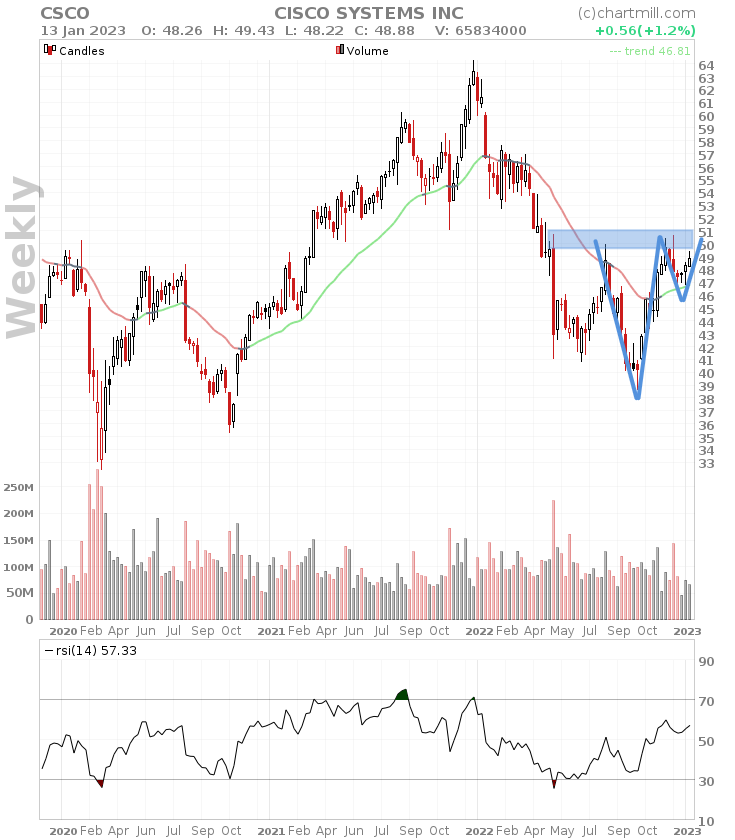
The price of Cisco Systems (CSCO) is quoted at the upper end of a sideways trading range while the long-term trend has turned positive since mid-October. Currently a cup and handle pattern is forming, a breakout above the $50 level may trigger more bullish momentum.
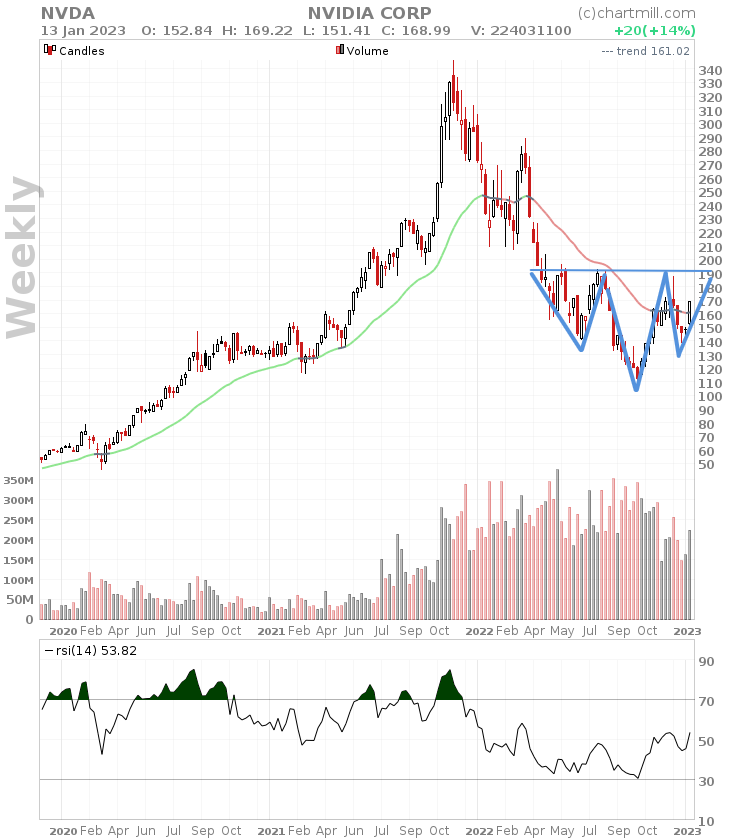
For Nvidia (NVDA), a reverse cup-and-shoulder pattern seems to be in the making. There is a solid bottom at the $110 price level. The price is flirting with the long-term average (ChartMill Trend Indicator). The price rose 14% last week and a clear reversal pattern is visible. A close above $190 would finalize the reverse head-and-shoulders pattern.
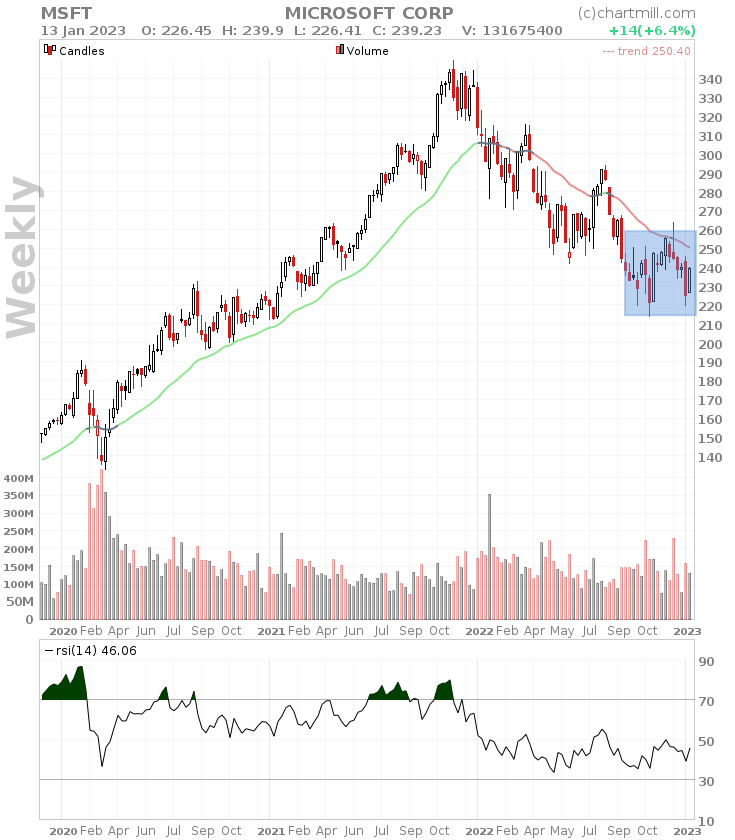
Finally, Microsoft (MSFT), last week's decline was reversed, the stock rose 6% again this week. However, the stock is still trading below the falling ChartMill Trend indicator and the price is moving rather sideways.
Screening Filter 2
Same conditions but specifically for companies with a market cap between 10B and 200B (largecaps).
Direct link to this filter with historical date set to friday january 13, 2023
Direct link to the filter (same filters without historical date set, the list is updated automatically after each trading day.)
This screen gives us 65 results. A brief discussion of the most important ones.
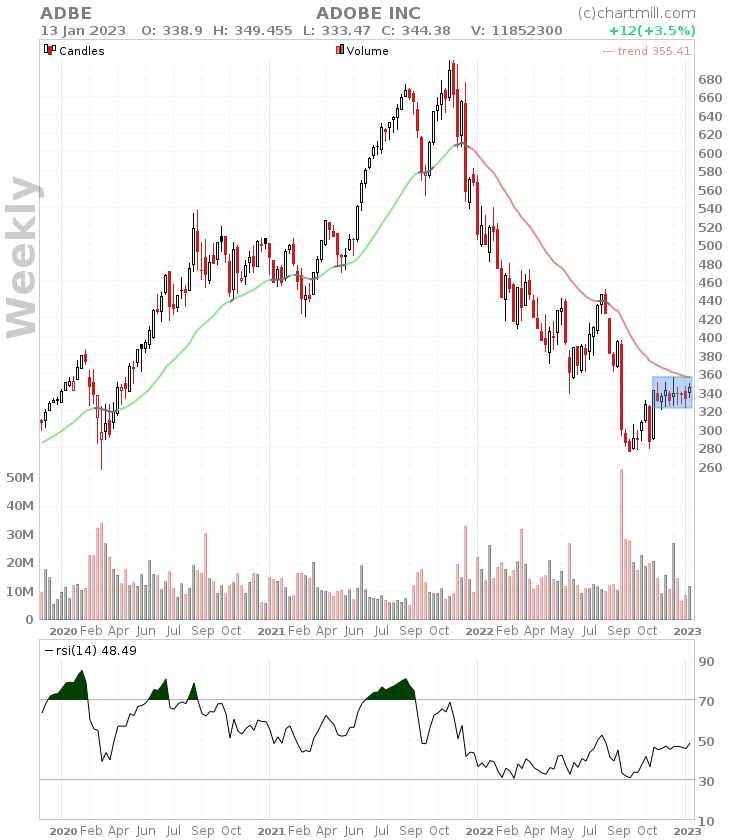
Adobe (ADBE) made its lowest double bottom at the $280 price level and has since recovered to around $340. The long-term trend is still negative but since mid-October the price has been moving between a remarkably narrow trading range and buying volumes are higher than selling volumes.
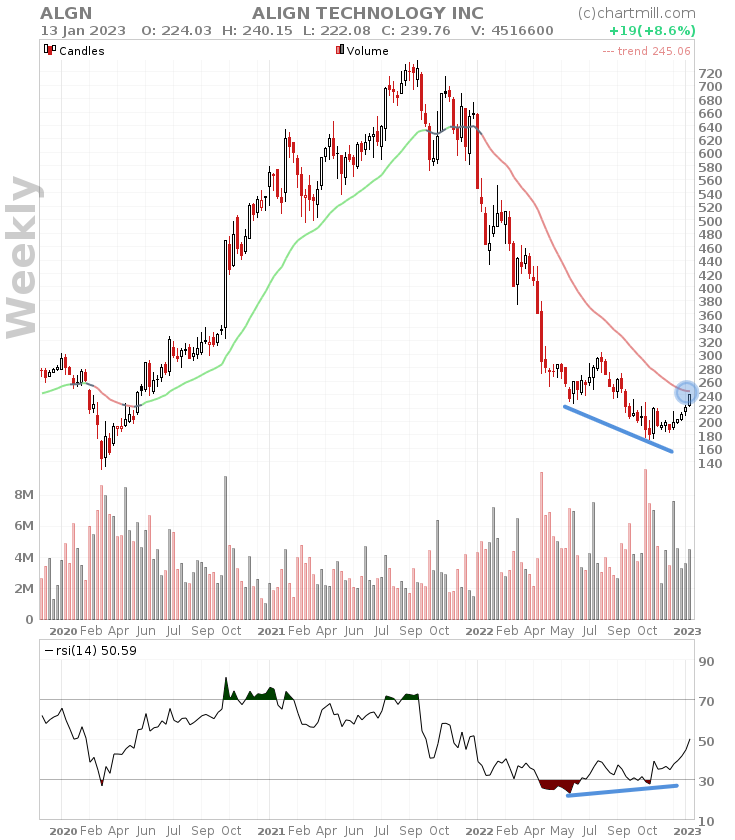
Align Technology (ALGN) shows a pronounced bullish divergence signal between the period April to early October 2022. The current price bottom corresponds to a multiple bottom that was also visible in 2018, 2019 and 2020. It looks like the price is about to test the descending ChartMill Trend Indicator for the first time since early 2022. Buy volumes have increased somewhat.
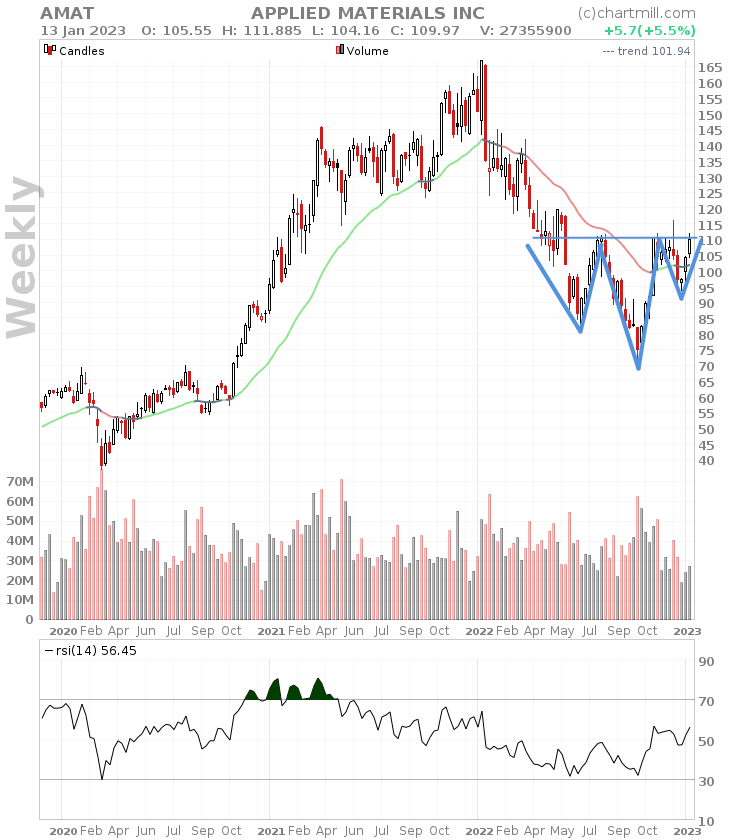
An inverted head-and-shoulders pattern is visible for Applied Materials (AMAT), neckline at $115.
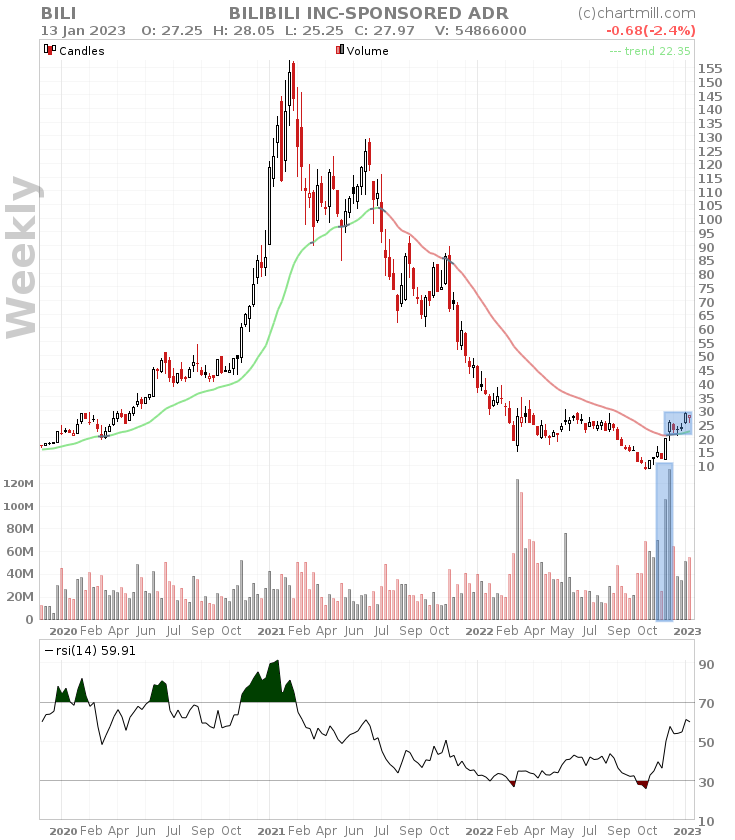
Bilibili (BILI) a lesser known stock but one where buying volume has increased remarkably. The long-term trend has turned positive again since several weeks. Technically interesting above the $30 level after the stock closed this week with an inside day candle.
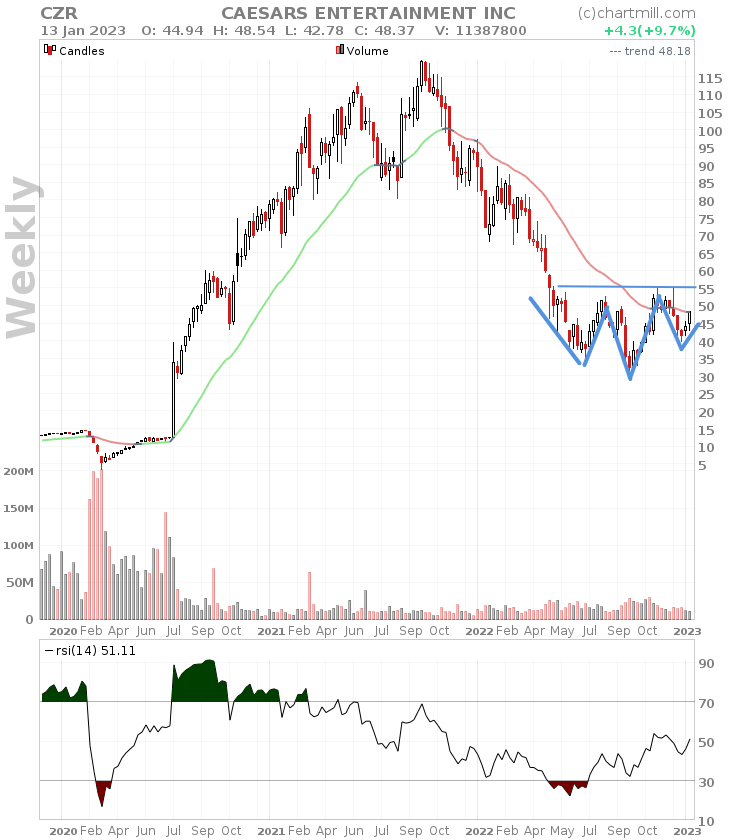
A bullish RSI divergence signal and the formation of an inverted head-and-shoulders pattern for Caesars Entertainment (CZR). Long-term trend neutral, price wise this becomes interesting at a close above $55.
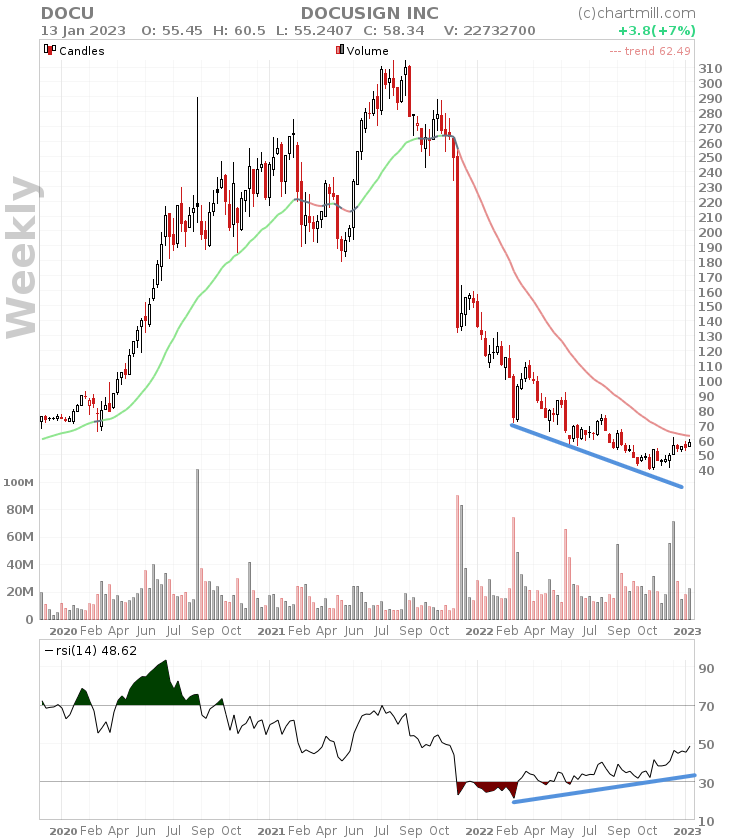
Docusign (DOCU) With a current price bottom at $40 and a price that was still quoted at $310 in September 2021, one can undoubtedly speak of a very sharp decline. The price is now quoting back at the bottom prices we saw in 2018 and 2019. The RSI indicator is rising and more and more buyers apparently find the current prices worth picking up the stock again. Purely technical buyers may be waiting for the formation of a first higher bottom.
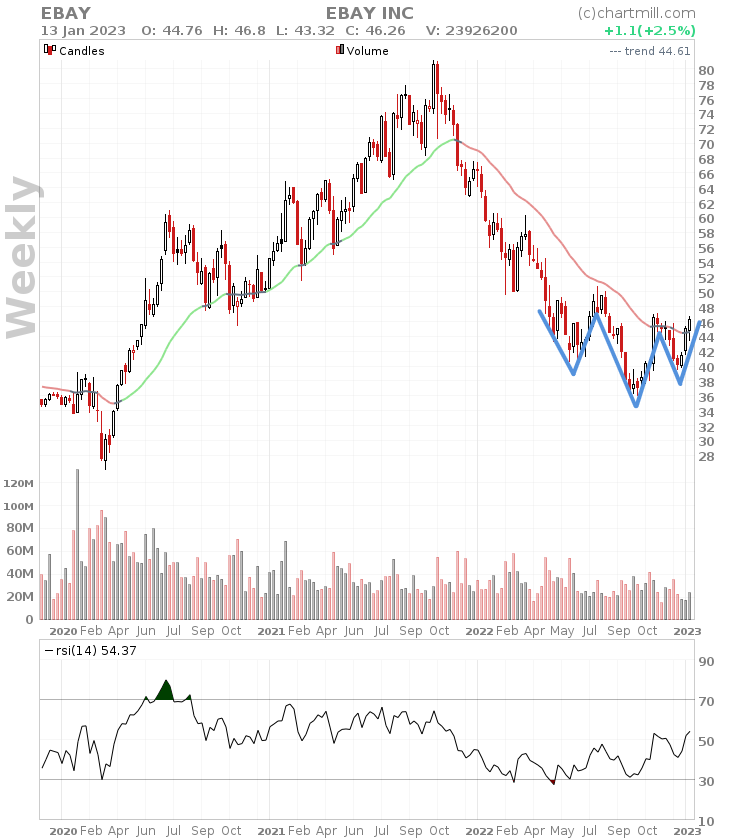
Also an inverted head-shoulder pattern for Ebay (EBAY) but without strong volume for now. Long-term trend neutral.
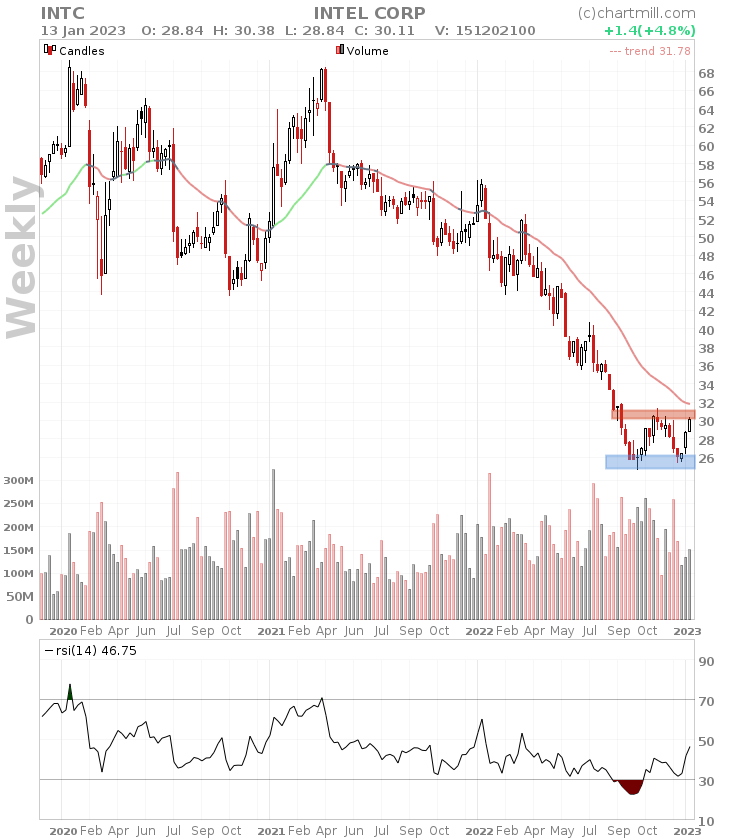
Intel (INTC) shows a double bottom, the price is currently in a sideways price range while the long-term trend remains very negative. However, a strong recovery over the past three weeks has brought the price to the upper side of the trading range. Selling volumes are still high.
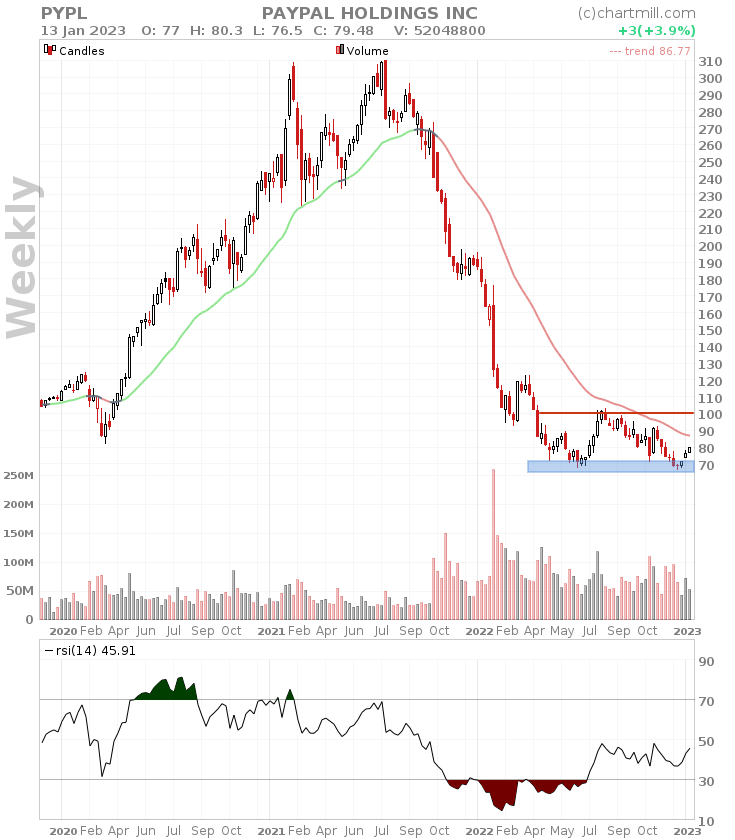
Clear signs of bottoming in Paypal (PYPL) which moved nearly 4% higher last week. First technical target is now $100 which would put the trend in neutral territory.
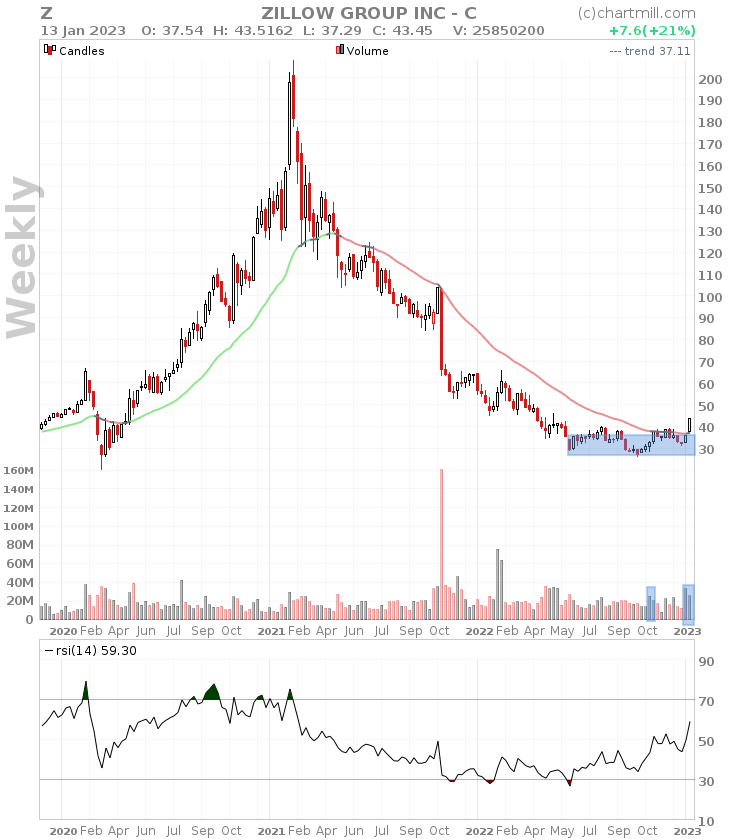
Zillow Group (Z) rose as much as 21% on a weekly basis confirming the bottom at $30. Buying volumes have clearly outpaced selling volumes since early October.
Summary
The aggressive price drop in technology stocks seems to have tempered somewhat. Quite a few stocks are showing the first signs of bottoming as the price has arrived at levels that already require us to look back to 2018/2019. The numerous bullish RSI divergence signals also point in this direction.
Furthermore, we note inverse head-and-shoulders patterns in several stocks and (slightly) increased buying volume in a number of stocks.
Being cautious remains the message for now, but for those who trade with a long-term perspective, diversify sufficiently and buy stocks in portions, there are undoubtedly opportunities at current levels to put some cash to work again.
For the stocks you like to keep an eye on, it is best to make a separate list so that you can easily consult and follow up on them. Tip: use alarms that warn you as soon as a stock reaches a certain price level. But many other alarms are also possible. Remember, good preparation is half the battle!
ALIGN TECHNOLOGY INC
NASDAQ:ALGN (5/8/2024, 11:50:48 AM)
269.72
-16.8 (-5.86%)
ALGN News
 3 minutes ago - ChartmillLet's take a look at the S&P500 stocks that are experiencing unusual volume in today's session.
In today's session, there are S&P500 stocks with remarkable trading volume. Explore the stocks exhibiting unusual volume in Wednesday's session.
 33 minutes ago - ChartmillWhat's going on in today's session: S&P500 movers
Get insights into the S&P500 index performance on Wednesday. Explore the top gainers and losers within the S&P500 index in today's session.
 3 hours ago - ChartmillWhich S&P500 stocks are gapping on Wednesday?
Curious about the market action on Wednesday? Dive into the US markets to explore the gap up and gap down stocks in the S&P500 index during today's session.
 5 days ago - The Motley FoolIBM's Deal and Meta's Report
How could IBM's buying HashiCorp help it? And what was it about Meta's earnings report that gave the market pause?
 7 days ago - Market News VideoOversold Conditions For Align Technology (ALGN)8 days ago - ChartmillWhat's going on in today's session: S&P500 movers
Top movers analysis one hour before the close of the markets of S&P500 on 2024-04-30: top gainers and losers in today's session.
8 days ago - ChartmillUncover the latest developments among S&P500 stocks in today's session. Stay tuned to the S&P500 index's top gainers and losers on Tuesday.Let's delve into the developments on the US markets in the middle of the day on Tuesday. Below, you'll find the top gainers and losers within the S&P500 index during today's session.
8 days ago - Market News VideoALGN Crosses Below Key Moving Average Level8 days ago - ChartmillTuesday's session is showcasing interesting market movements in the S&P500 index, with notable gap up and gap down stocks. Stay updated with the gapping S&P500 stocks in today's session.Looking for the S&P500 stocks that are experiencing notable gaps on Tuesday? Find out which stocks are gapping up and gapping down in the S&P500 index during today's session.
 9 days ago - InvestorPlaceCutting Edge Picks: 3 Med Tech Stocks With Room to Run
The med tech stocks are worth checking out for value investors seeking potentially overlooked growth catalysts.
 12 days ago - Align Technology, Inc.Align Technology Announces $150 Million Open Market Repurchase13 days ago - ChartmillCurious about which S&P500 stocks are generating unusual volume on Thursday? Find out below.
These S&P500 stocks have an unusual volume in today's session