Using The 200 Simple Moving Average - 200 SMA
By Kristoff De Turck - reviewed by Aldwin Keppens
Last update: Oct 11, 2023
The 200-day moving average is used by both technical and fundamental investors to obtain insight into the long-term price trend of the stock/etf/index....
Both the direction of the SMA 200 and the position of the price relative to this average line play a role in determining the long-term trend.
How the 200 SMA is calculated and how you can use it in your trading strategy is covered in this article.
How does the SMA 200 work?
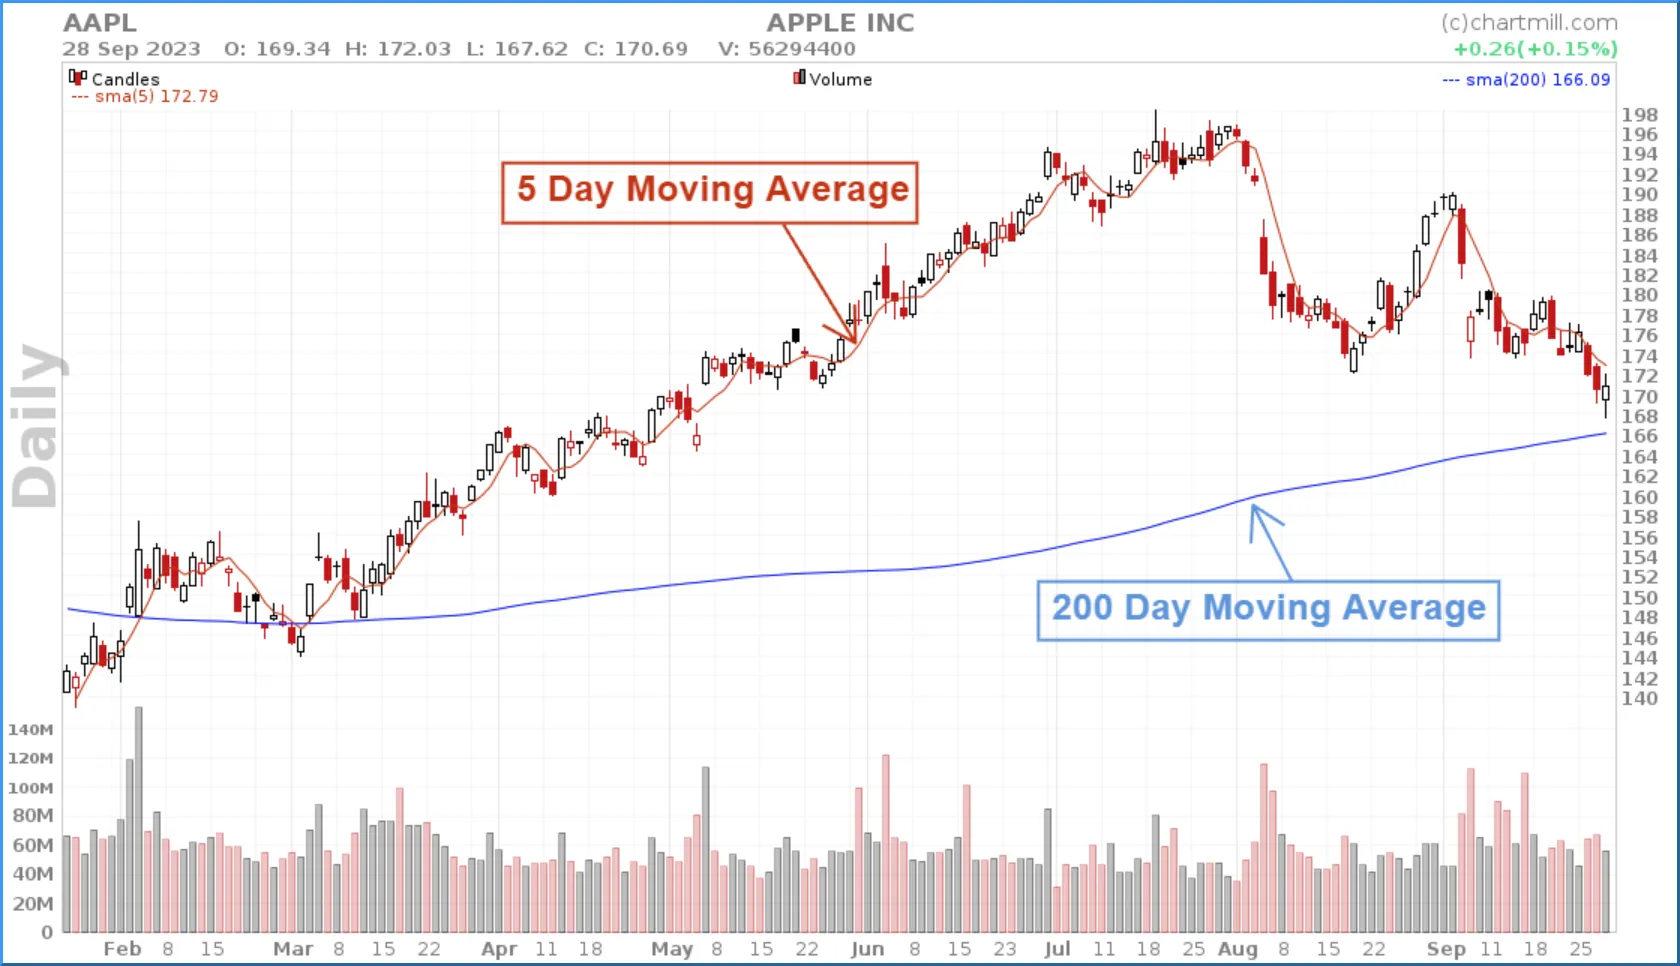
To explain how the SMA 200 works, we will use an SMA5 as an example. Indeed, the calculation is similar, only the number of periods is limited to 5 instead of 200.
Suppose stock X showed a closing price of 24, 23, 26, 27, 29 for the last 5 days.
The simple moving average is obtained by adding these 5 values and then dividing them by 5.
(24+23+26+27+29)/5 = 25,8
This value is subsequently plotted on the chart. After the close of the trading day, the most recent value is added to the formula and the first value disappears. Hence the name "moving" average. Connecting the obtained value each day creates a smooth line on the price chart.
The calculation of the SMA 200 is done in exactly the same way, only it is done based on many more periods (200).
What are the best ways to use the 200 daily moving average?
There are several ways you can use this moving average in your trading strategy.
As trend indicator or trend filter
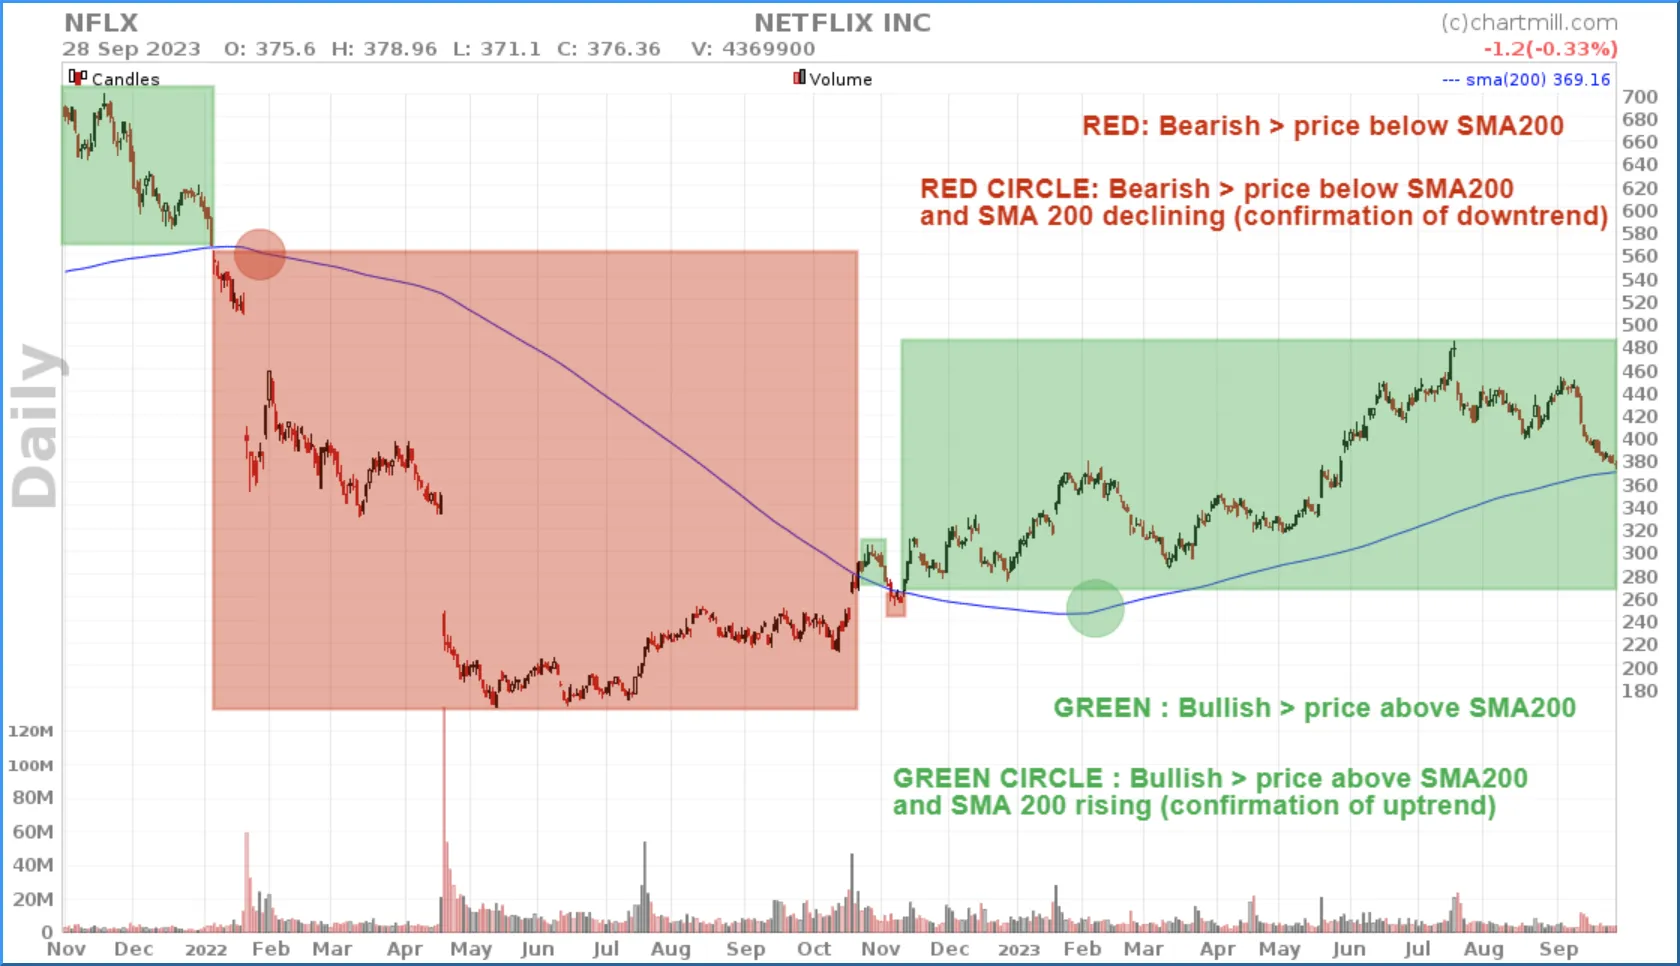
The most common use is as a trend indicator, to determine whether a stock is in a positive or negative long-term trend.
For a positive LT trend:
- The price of the stock should quote above the rising SMA200
- The SMA 200 is rising (trend confirmation)
For a negative LT trend:
- The share price must quote below the falling SMA200
- The SMA 200 is falling (trend confirmation)
Many times this long-term average will be extended with other averages over shorter periods such as the SMA 20, SMA 50 or even the SMA 100.
That way you get a more complete picture with both the short and medium term trend of the stock in question.
How those different ones position themselves relative to each other gives insight into the strength of the trend. For example, if the various MAs are all rising and are also nicely ordered in sequence (the shortest MA is closest to the price, followed by the medium and long MAs), this is a sign that the current trend is very strong.
Moving Averages that crisscross back and forth is an indication that the stock is moving rather in a sideways trend with no clear direction.
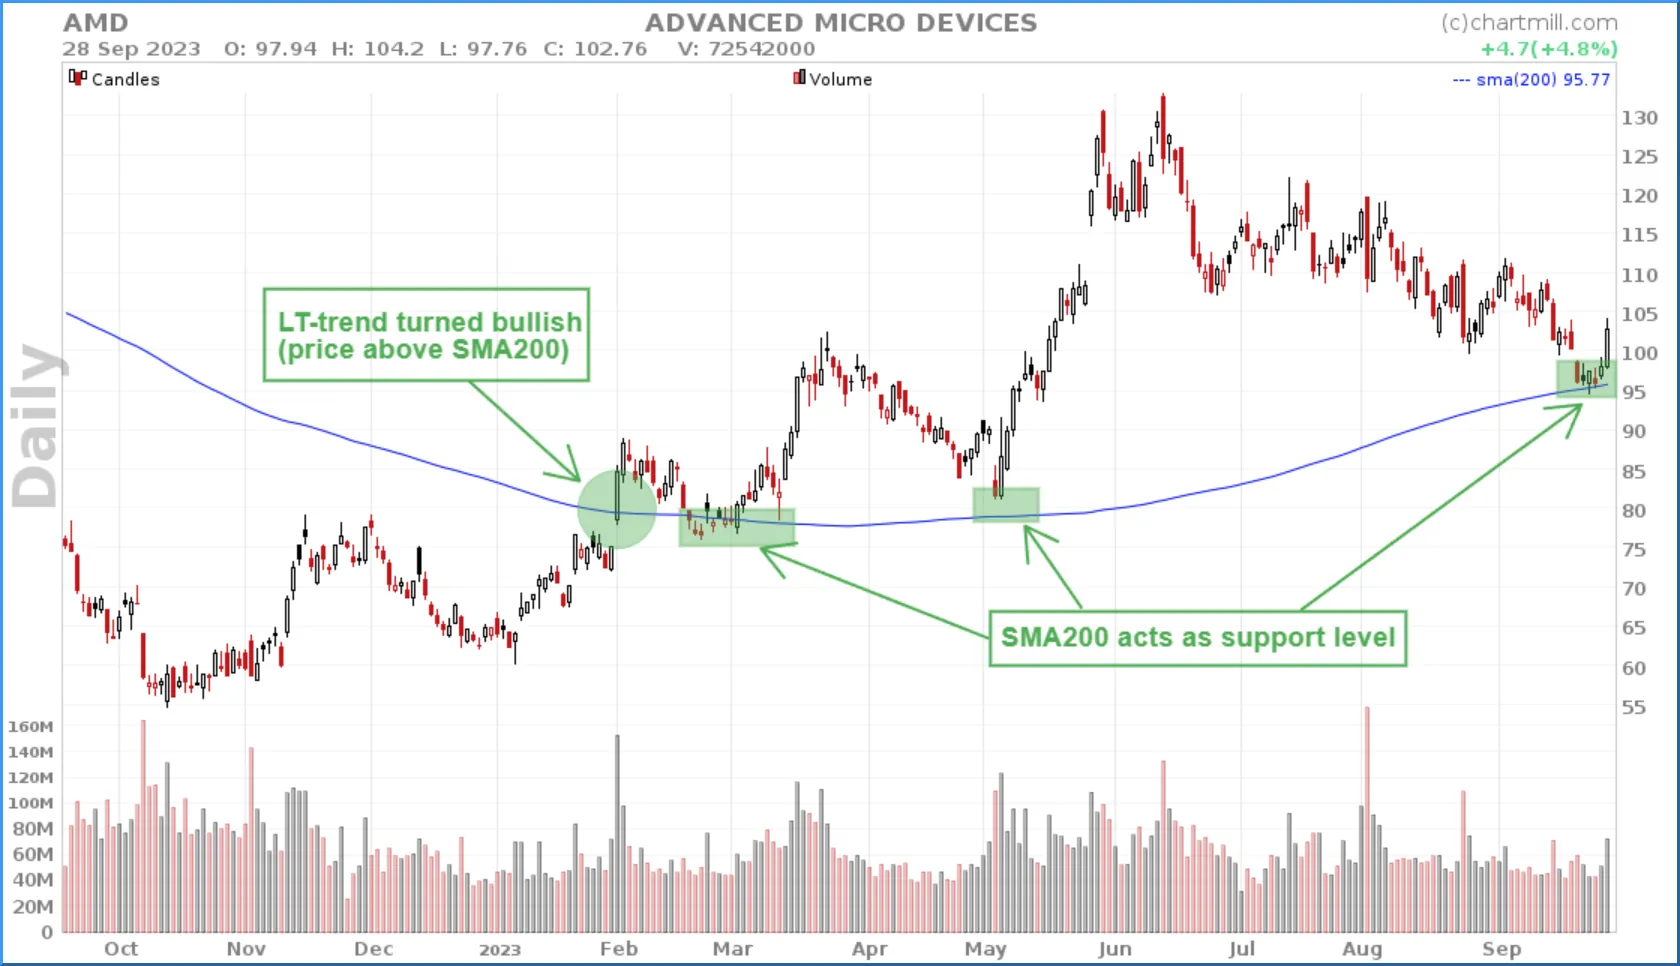
As a support and resistance zone
Just because the SMA 200 is watched by a lot of traders and investors, this average line regularly acts as a support or resistance level.
When a stock is in a rising trend and temporarily experiences a price decline, the SMA 200 forms a kind of natural price barrier where buyers re-enter the market and thereby push the price of the stock back up.
The same applies in the opposite direction, by the way. If a stock has been falling for some time and the price suddenly rises, there is a good chance that short-term traders who used the surge to take long positions will take their profits off the table once the SMA 200 is touched. If new short positions are then taken there as well, the role of the SMA 200 as resistance is further reinforced and you see the price eventually fall back down.
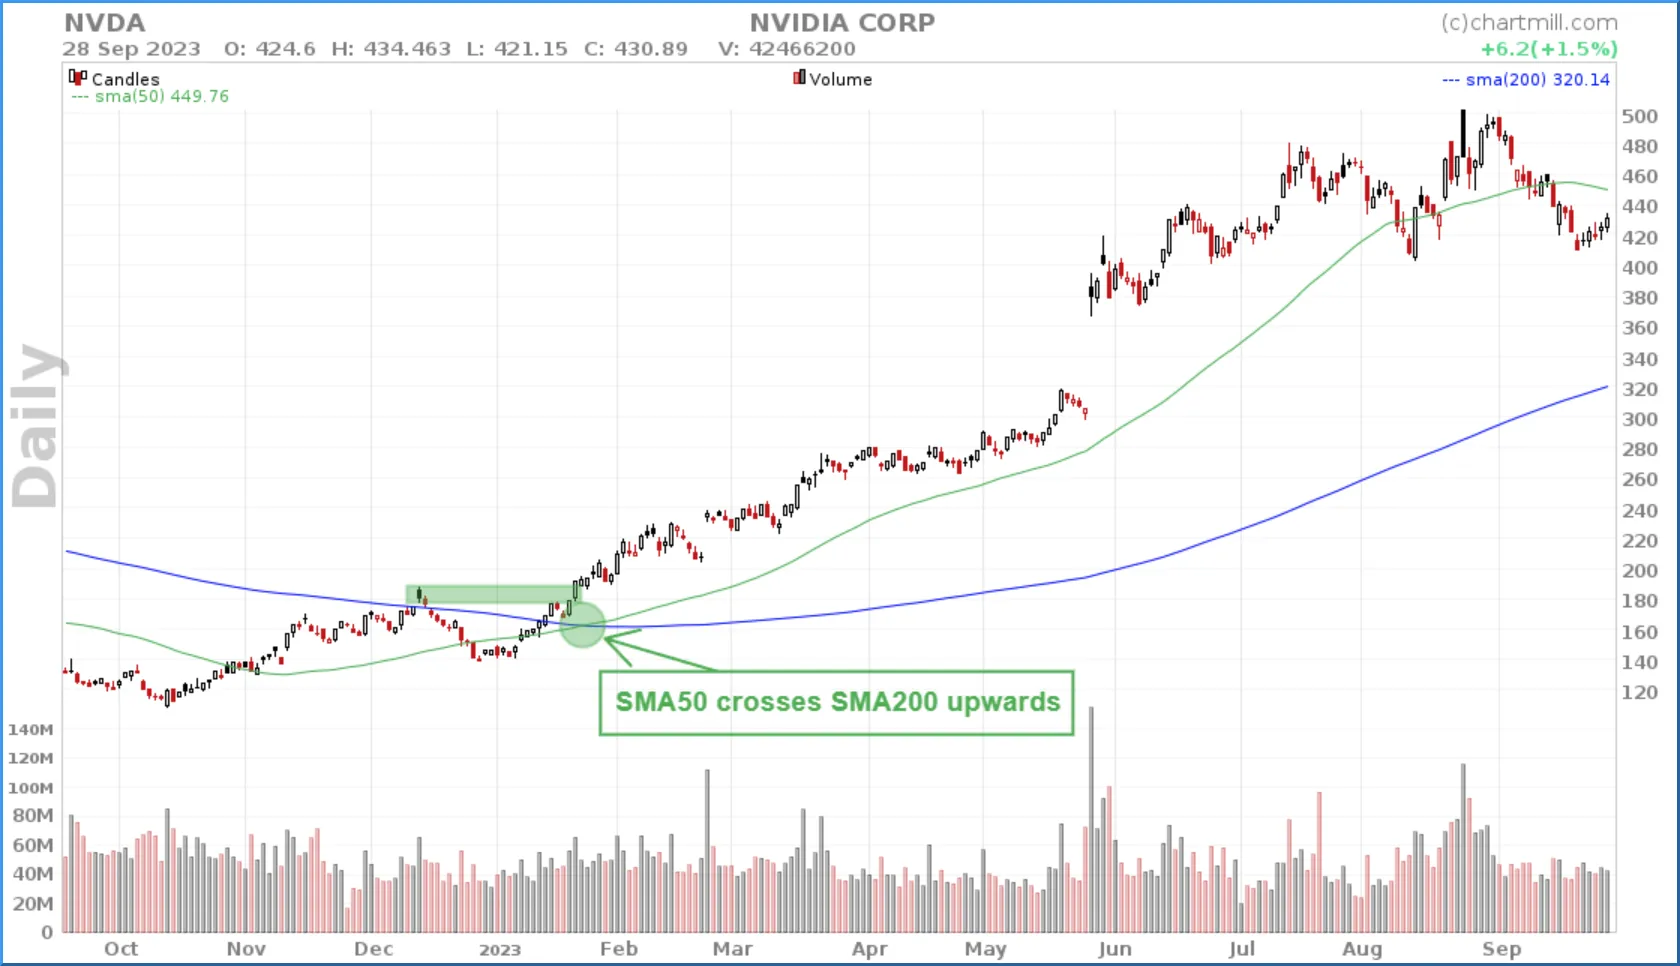
As a signal in a specific MA crossover trading strategy (long-term)
Finally, the 200 SMA can also be part of a long-term trading strategy where it is combined with a shorter moving average line.
The crossover of both MAs are then used as a buy or sell signal. A commonly used combination, for example, is the SMA 200 with the SMA50. As a matter of fact, this crossing has a specific name, the golden or death cross.
When the short MA (50) crosses the long MA upwards a buy signal occurs. If the short MA crosses the long MA downwards there is a sell signal.
FAQ
What happens when a stock breaks its 200-day moving average?
When the price of a stock breaks its 200-day moving average downward, it is an indication that the long-term trend is changing from positive to negative.
For long-term trend traders, this is the sign to liquidate open long positions.
In the opposite case, when the price breaks upward through the SMA200 this is the sign for long-term investors to consider only long positions.
Which is better; 50-day or 200-day moving average?
It all depends on what exactly you want to measure. The 200-day average averages out a 200-day period and thus will react slowly to sudden price fluctuations. It is ideally suited to assess a stock's long-term trend.
The 50-day average, on the other hand, only takes into account the last 50 trading days and thus will be a bit more volatile by giving more weight to recent price action. This average is better suited to get a view of the short-term trend.
Which is the best choice, SMA 200 or EMA 200?
The difference between a simple and exponential moving average is that the simple variant assigns the same weight to all price data to arrive at a simple mathematical average.
Recent rising or falling prices will initially have very little impact on the course of the SMA200, precisely because the most recent price point is assigned the same weight as the first in the series.
This gives the advantage that if such upswings or downswings are short-lived they will have little impact on the course of the long-term trend.
When using an exponential average, it is somewhat different. In that case, more weight is given to more recent price formation because a multiplier is applied for this. As a result, the weight of the older price data is reduced and the moving average will react slightly faster to recent price developments.
Consequently, recently rising or falling prices will have a faster impact on the course of the long-term trend, which is particularly interesting if that new price data is the starting point of a clear trend. With the use of an EMA, that trend will be recognized more quickly.
Related Articles
The Simple Moving Average (SMA)
The moving average (MA) is a technical indicator that accumulates price points of an instrument over a given period of time and divides them by the number of points, creating a single trend line. Read more...
The Exponential Moving Average (EMA)
The EMA, the exponential moving average, gives more weight to recent prices than a simple moving average. Read more...
How to Use Moving Averages to Determine the Trend?
Moving averages can be used in many ways in different types of trading strategies.. Perhaps one of the best known and easiest way is to determine the trend using a specific moving average. Read more...
Exploring The Best Moving Averages For Swing Trading Success
Traders employ various tools and indicators to make decisions regarding entry and exit points. One such tool that plays a crucial role in swing trading is the moving average. Read more...
Simple vs Exponential Moving Average: Unveiling the Best Choice for Investment and Trading Strategies
This article aims to provide a comprehensive comparison between exponential and simple moving averages, shedding light on their characteristics, strengths, and weaknesses. Read more...
Stock Market Golden Cross
This represents a critical technical analysis pattern that occurs when two essential moving averages converge, signifying a potential shift in the market's direction. Read more...
Death Cross Stocks Chart Pattern
The death cross is a pattern that forms when the short-term price average falls below the long-term price average. Read more...