Triple Bottom
By Kristoff De Turck - reviewed by Aldwin Keppens
Last update: Apr 27, 2023
How to recognize a Triple Bottom Chart Pattern?
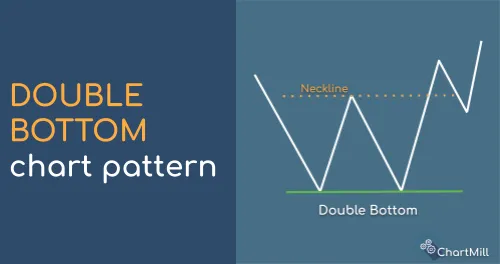
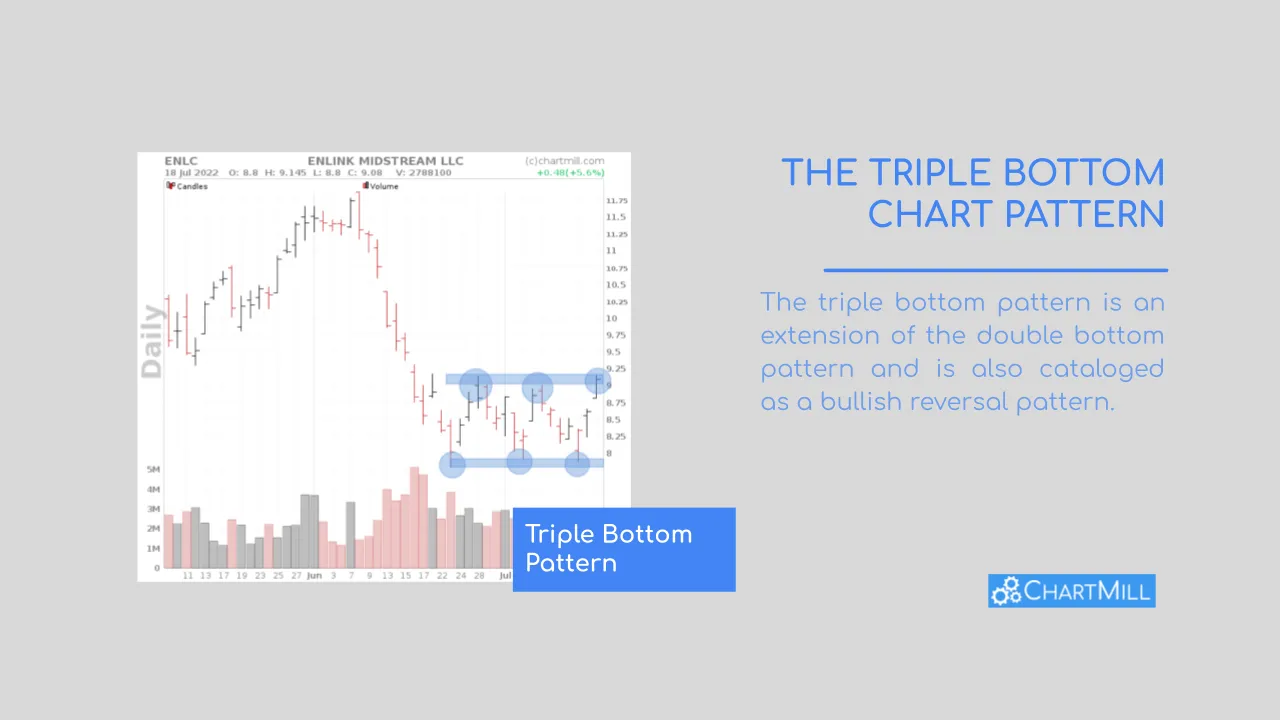
The triple bottom pattern is an extension of the double bottom pattern and is also cataloged as a bullish reversal pattern.
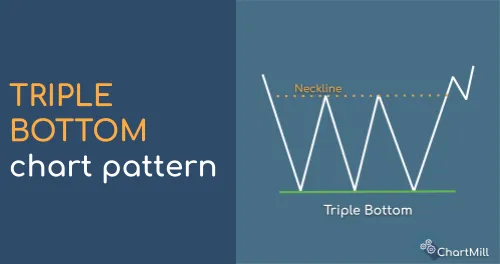
The characteristics are almost completely the same as the double bottom with the only difference that the support base of the pattern consists of not two but three bottoms with a temporary price recovery in between. Thus, not 1 but 2 intermediate tops are present.
How does a Triple Bottom Pattern arise?
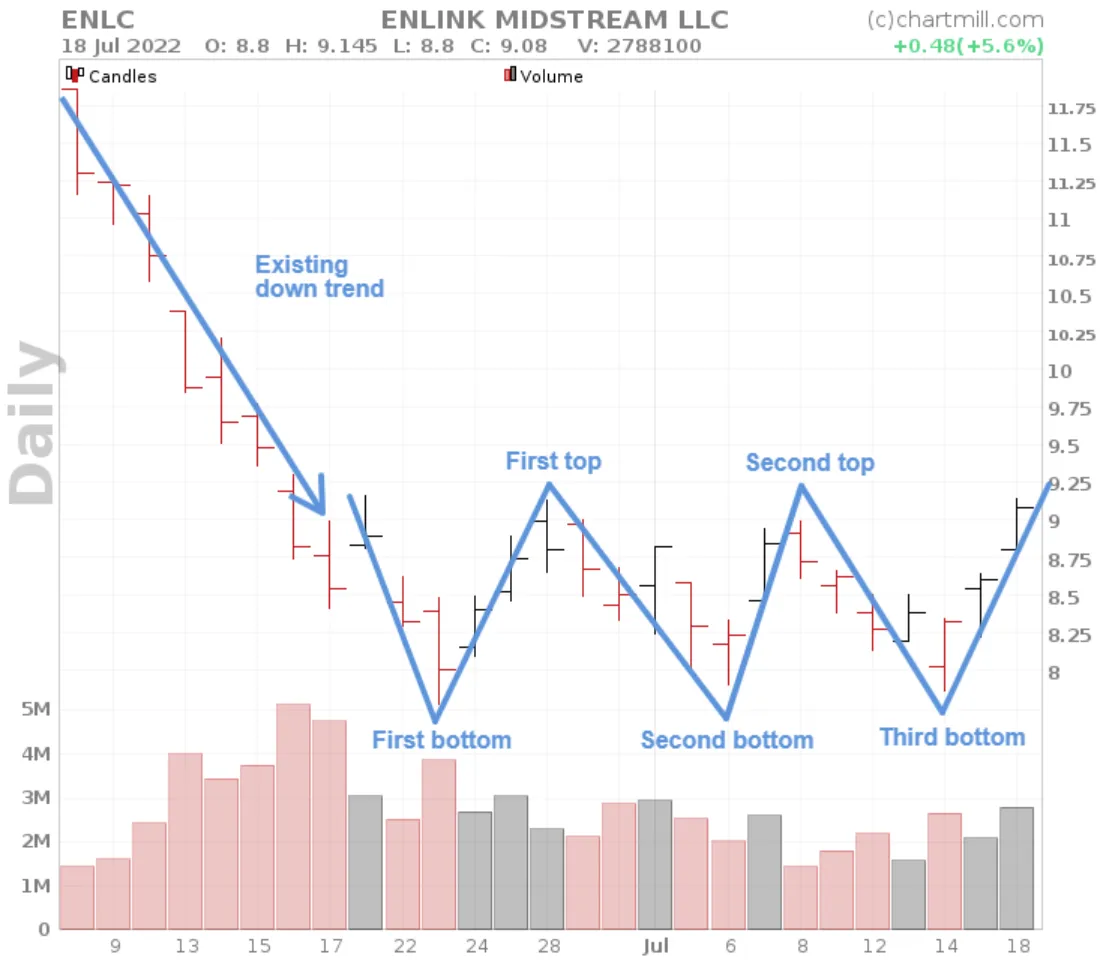
- It starts from a downtrend where after the formation of a first bottom there is a temporary moderate price recovery.
- With the first price recovery, a lower first top is formed in the existing downtrend after which the price drops again to the level of the first bottom.
- In a normal downtrend a second lower bottom would now follow, but this is not the case. Indeed, a price recovery occurs from the same price floor, making a double bottom visible.
- The second price recovery reaches approximately to the first intermediate top so that after the double bottom a double top is now formed. In the regular double bottom pattern you then get a typical upward breakout.
- In this case, however, the price will first test the bottom a third time, creating the triple bottom pattern. The fact that even with the third test buyers re-enter the market shows that the support is strong.
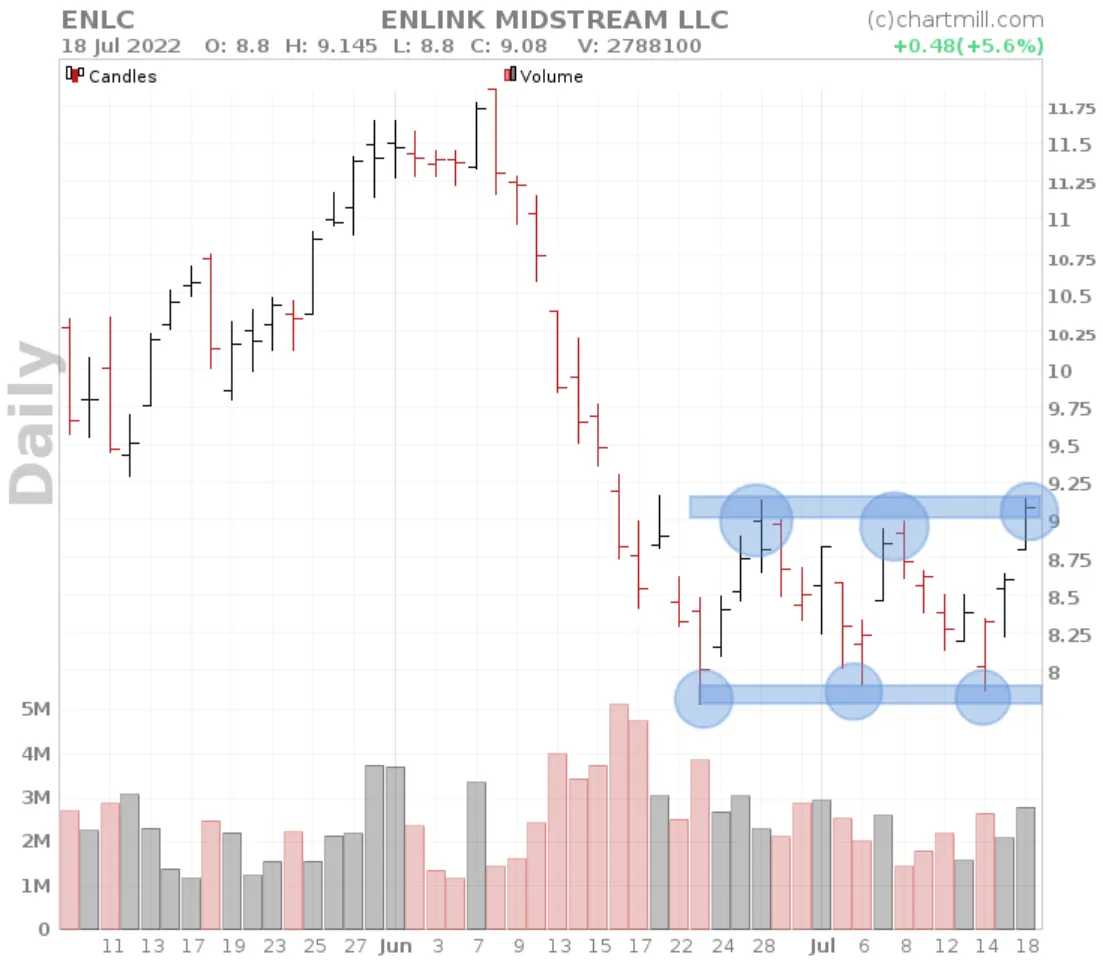
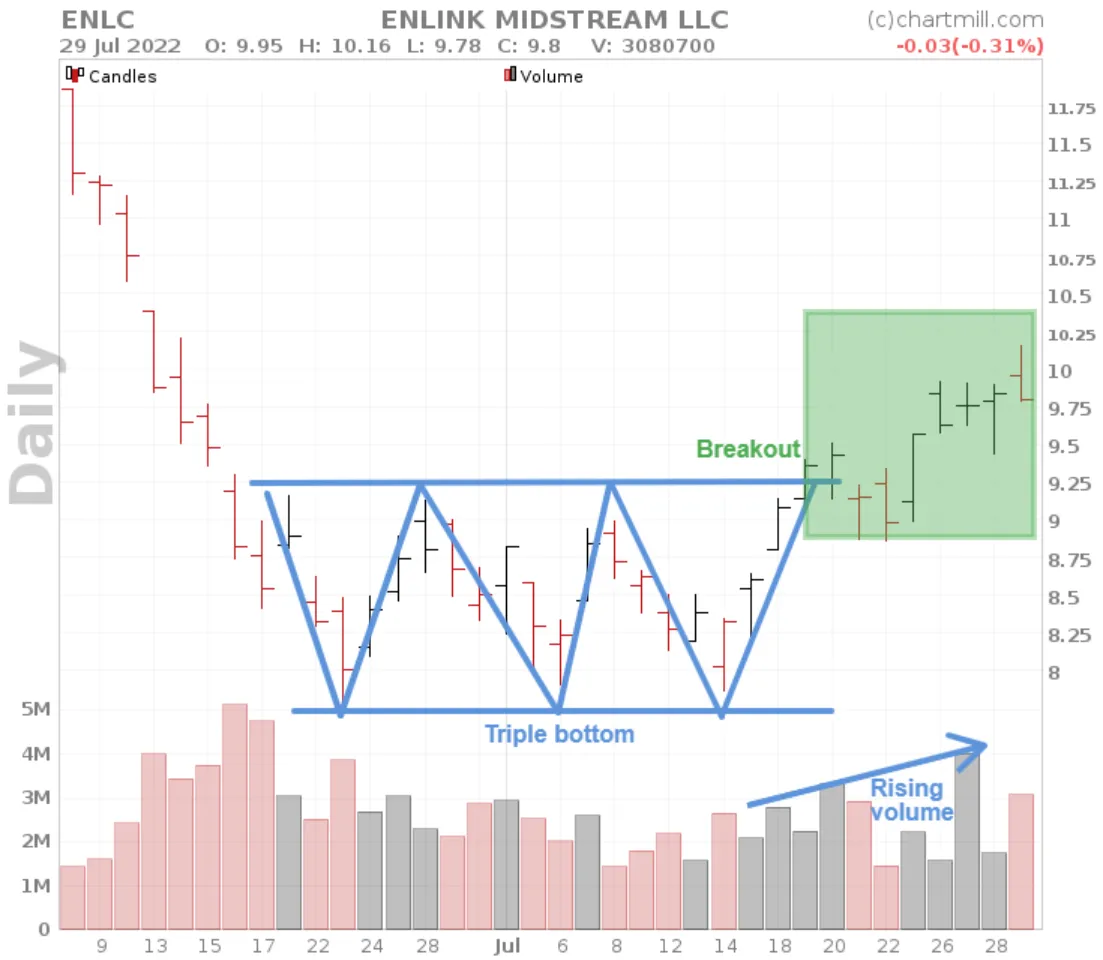
Be sure to keep an eye on volume with this pattern as well.
The intermediate descents should happen with relatively low volume and the buying volume should be clearly higher when the price rebounds from the bottom.
Thus, the breakout in this pattern does not occur until three consecutive bottoms are visible. If then the double top is tested for a third time the breakout follows, preferably with a clear volume spike.
The additional bottom ensures that the base is stronger than in the double bottom pattern because the sideways trading range covers a longer period.
It is important that the bottoms and tops are approximately equal and the movements are not too large. Only in this way will there be fairly easily identifiable horizontal narrow trading ranges and turning points that you as a trader can try to anticipate during the eventual upward breakout.
Triple Bottom price target and stoploss
In terms of trading strategy and stoploss determination, the same rules apply as for the double bottom chart pattern.