
NAPCO SECURITY TECHNOLOGIES (NASDAQ:NSSC) has caught the eye of our stock screener as an affordable growth stock. NASDAQ:NSSC is displaying robust growth metrics and also excels in terms of profitability, solvency, and liquidity. Additionally, it appears to be reasonably priced. Let's delve into the details.
Assessing Growth Metrics for NASDAQ:NSSC
ChartMill assigns a Growth Rating to every stock. This score ranges from 0 to 10 and evaluates the different growth aspects like EPS and Revenue, both in the past as in the future. NASDAQ:NSSC scores a 8 out of 10:
- The Earnings Per Share has grown by an impressive 38.14% over the past year.
- NSSC shows a strong growth in Earnings Per Share. Measured over the last years, the EPS has been growing by 31.95% yearly.
- Looking at the last year, NSSC shows a quite strong growth in Revenue. The Revenue has grown by 11.08% in the last year.
- The Revenue has been growing by 12.91% on average over the past years. This is quite good.
- Based on estimates for the next years, NSSC will show a very strong growth in Earnings Per Share. The EPS will grow by 23.65% on average per year.
- Based on estimates for the next years, NSSC will show a quite strong growth in Revenue. The Revenue will grow by 14.49% on average per year.
A Closer Look at Valuation for NASDAQ:NSSC
ChartMill assigns a Valuation Rating to each stock, ranging from 0 to 10. This rating is calculated by analyzing different valuation elements, such as price to earnings and free cash flow, both in absolute terms and relative to the market and industry. In the case of NASDAQ:NSSC, the assigned 5 reflects its valuation:
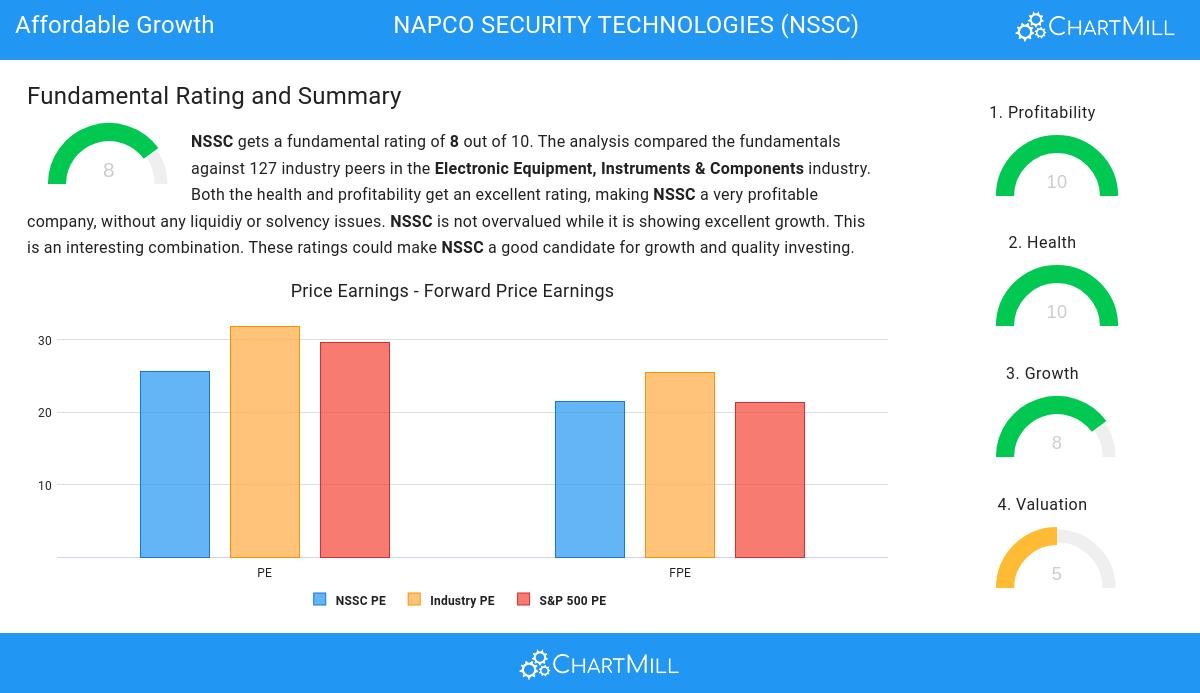
- Based on the Price/Earnings ratio, NSSC is valued a bit cheaper than 64.29% of the companies in the same industry.
- NSSC's Price/Forward Earnings ratio is a bit cheaper when compared to the industry. NSSC is cheaper than 61.90% of the companies in the same industry.
- Based on the Price/Free Cash Flow ratio, NSSC is valued a bit cheaper than the industry average as 62.70% of the companies are valued more expensively.
- The excellent profitability rating of NSSC may justify a higher PE ratio.
- A more expensive valuation may be justified as NSSC's earnings are expected to grow with 23.65% in the coming years.
Health Examination for NASDAQ:NSSC
ChartMill utilizes a Health Rating to assess stocks, scoring them on a scale of 0 to 10. This rating takes into account a variety of liquidity and solvency ratios, both in absolute terms and in comparison to industry peers. NASDAQ:NSSC has earned a 10 out of 10:
- NSSC has an Altman-Z score of 32.31. This indicates that NSSC is financially healthy and has little risk of bankruptcy at the moment.
- NSSC's Altman-Z score of 32.31 is amongst the best of the industry. NSSC outperforms 98.41% of its industry peers.
- There is no outstanding debt for NSSC. This means it has a Debt/Equity and Debt/FCF ratio of 0 and it is amongst the best of the sector and industry.
- NSSC has a Current Ratio of 7.93. This indicates that NSSC is financially healthy and has no problem in meeting its short term obligations.
- NSSC has a Current ratio of 7.93. This is amongst the best in the industry. NSSC outperforms 90.48% of its industry peers.
- A Quick Ratio of 6.08 indicates that NSSC has no problem at all paying its short term obligations.
- NSSC has a better Quick ratio (6.08) than 90.48% of its industry peers.
Looking at the Profitability
ChartMill employs its own Profitability Rating system for stock evaluation. This score, ranging from 0 to 10, is derived from an analysis of diverse profitability metrics and margins. In the case of NASDAQ:NSSC, the assigned 10 is noteworthy for profitability:
- The Return On Assets of NSSC (24.05%) is better than 99.21% of its industry peers.
- NSSC's Return On Equity of 27.86% is amongst the best of the industry. NSSC outperforms 96.03% of its industry peers.
- Looking at the Return On Invested Capital, with a value of 25.89%, NSSC belongs to the top of the industry, outperforming 99.21% of the companies in the same industry.
- Measured over the past 3 years, the Average Return On Invested Capital for NSSC is significantly above the industry average of 9.12%.
- The last Return On Invested Capital (25.89%) for NSSC is above the 3 year average (18.84%), which is a sign of increasing profitability.
- With an excellent Profit Margin value of 25.58%, NSSC belongs to the best of the industry, outperforming 98.41% of the companies in the same industry.
- In the last couple of years the Profit Margin of NSSC has grown nicely.
- NSSC's Operating Margin of 28.21% is amongst the best of the industry. NSSC outperforms 100.00% of its industry peers.
- In the last couple of years the Operating Margin of NSSC has grown nicely.
- Looking at the Gross Margin, with a value of 52.93%, NSSC belongs to the top of the industry, outperforming 88.89% of the companies in the same industry.
- In the last couple of years the Gross Margin of NSSC has grown nicely.
Every day, new Affordable Growth stocks can be found on ChartMill in our Affordable Growth screener.
Check the latest full fundamental report of NSSC for a complete fundamental analysis.
Disclaimer
This is not investing advice! The article highlights some of the observations at the time of writing, but you should always make your own analysis and invest based on your own insights.