
CONSOLIDATED EDISON INC (NYSE:ED) was identified as a Technical Breakout Setup Pattern by our stockscreener. Such a pattern occurs when we see a pause in a strong uptrend: after a strong rise the stock is consolidating a bit and at some point the trend may be continued. Whether this actually happens can not be predicted of course, but it may be a good idea to keep and eye on NYSE:ED.
Insights from Technical Analysis
ChartMill assigns a proprietary Technical Rating to each stock. The score is computed daily by evaluating various technical indicators and properties. The score ranges from 0 to 10.
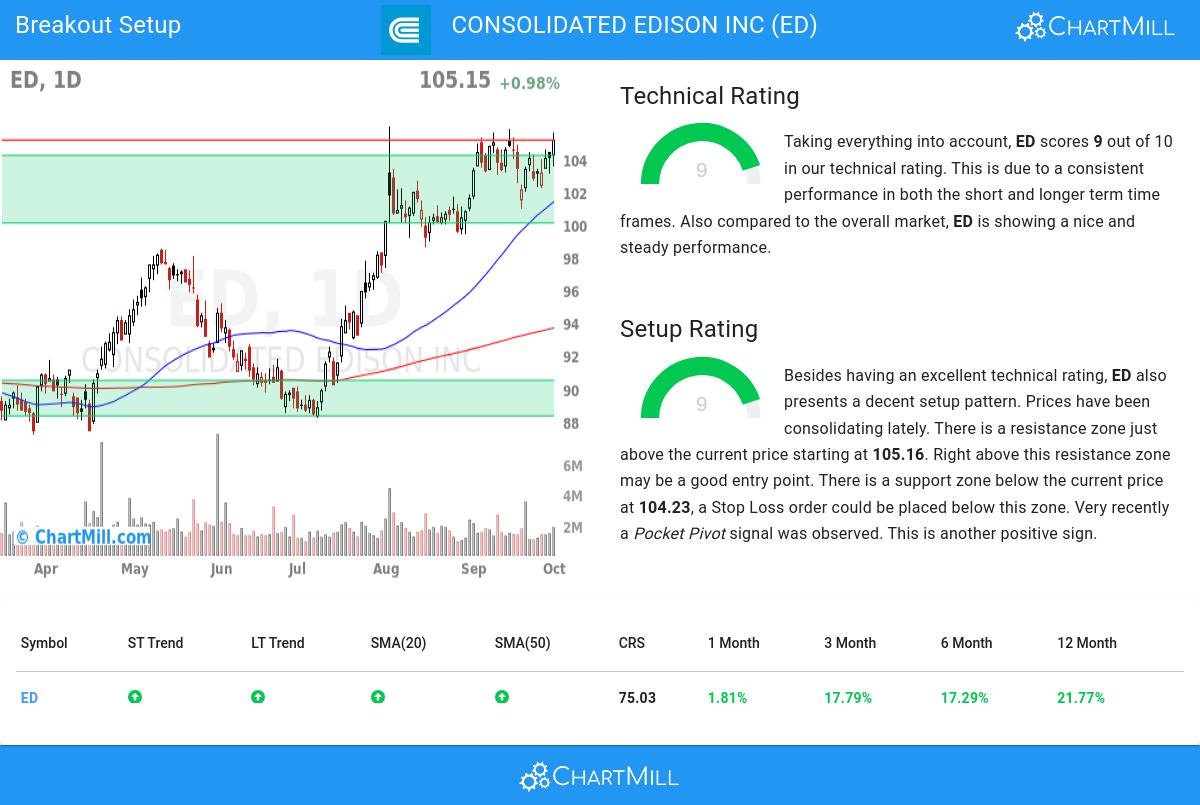
We assign a technical rating of 9 out of 10 to ED. This is due to a consistent performance in both the short and longer term time frames. Also compared to the overall market, ED is showing a nice and steady performance.
- The long and short term trends are both positive. This is looking good!
- When comparing the yearly performance of all stocks, we notice that ED is one of the better performing stocks in the market, outperforming 75% of all stocks.
- ED is currently trading near its 52 week high, which is a good sign. The S&P500 Index however is also trading near new highs, which makes the performance in line with the market.
- ED is part of the Multi-Utilities industry. There are 25 other stocks in this industry, ED did better than 62% of them.
- In the last month ED has a been trading in a tight range between 100.95 and 105.82.
For an up to date full technical analysis you can check the technical report of ED
How do we evaluate the setup for NYSE:ED?
ChartMill incorporates a Setup Rating in its analysis, which measures the extent of consolidation in a stock over recent days and weeks. This rating, ranging from 0 to 10, is updated daily and takes into account multiple short-term technical indicators. The current setup rating for NYSE:ED is 9:
Besides having an excellent technical rating, ED also presents a decent setup pattern. Prices have been consolidating lately. There is a resistance zone just above the current price starting at 105.16. Right above this resistance zone may be a good entry point. There is a support zone below the current price at 104.23, a Stop Loss order could be placed below this zone. Another positive sign is the recent Pocket Pivot signal.
How to trade NYSE:ED?
One strategy to consider is waiting for the actual breakout to occur, where the stock breaks out above the current consolidation zone. Traders can then enter a buy position, anticipating further upward momentum. As a risk management measure, it is advisable to set a stop loss order below the consolidation zone.
This article should in no way be interpreted as trading advice. You should always make your own analysis and trade or not trade based on your own observations and style. The article is based purely on some technical observations.
Our Breakout screener lists more breakout setups and is updated daily.
Disclaimer
This article should in no way be interpreted as advice. The article is based on the observed metrics at the time of writing, but you should always make your own analysis and trade or invest at your own responsibility.